

Run experiments and inspect results
Before running a job, complete onboarding and confirm that you have access to your existing lab and authorized instruments. If they are unavailable, contact Conductor Quantum Admins before attempting a run.
Choose how to run
Control supports three ways to work with your instruments. Choose based on whether you need a complete sequence, one ready-made experiment, or your own code.
Workflows (typically calibrations)
Choose a workflow when you want a coordinated sequence of experiments rather than running each step yourself. Workflows typically perform calibrations: later steps use the accepted results of earlier steps to prepare or characterize the device.
For example, Single-Qubit Bring-Up combines resonator and qubit spectroscopy, pulse and readout calibration, and coherence characterization. Select a workflow supported by your lab, choose its target, and review its settings before starting. Control records the run and its experiment results; scientific acceptance and device-state updates follow that workflow’s rules. A completed measurement is not by itself a successful calibration.
Templated experiments
Choose a templated experiment when you want one ready-made measurement configured for a specific task, without writing the acquisition and analysis yourself. Select the experiment, target, and exposed settings in Run job. Available templates depend on your lab’s configuration and hardware.
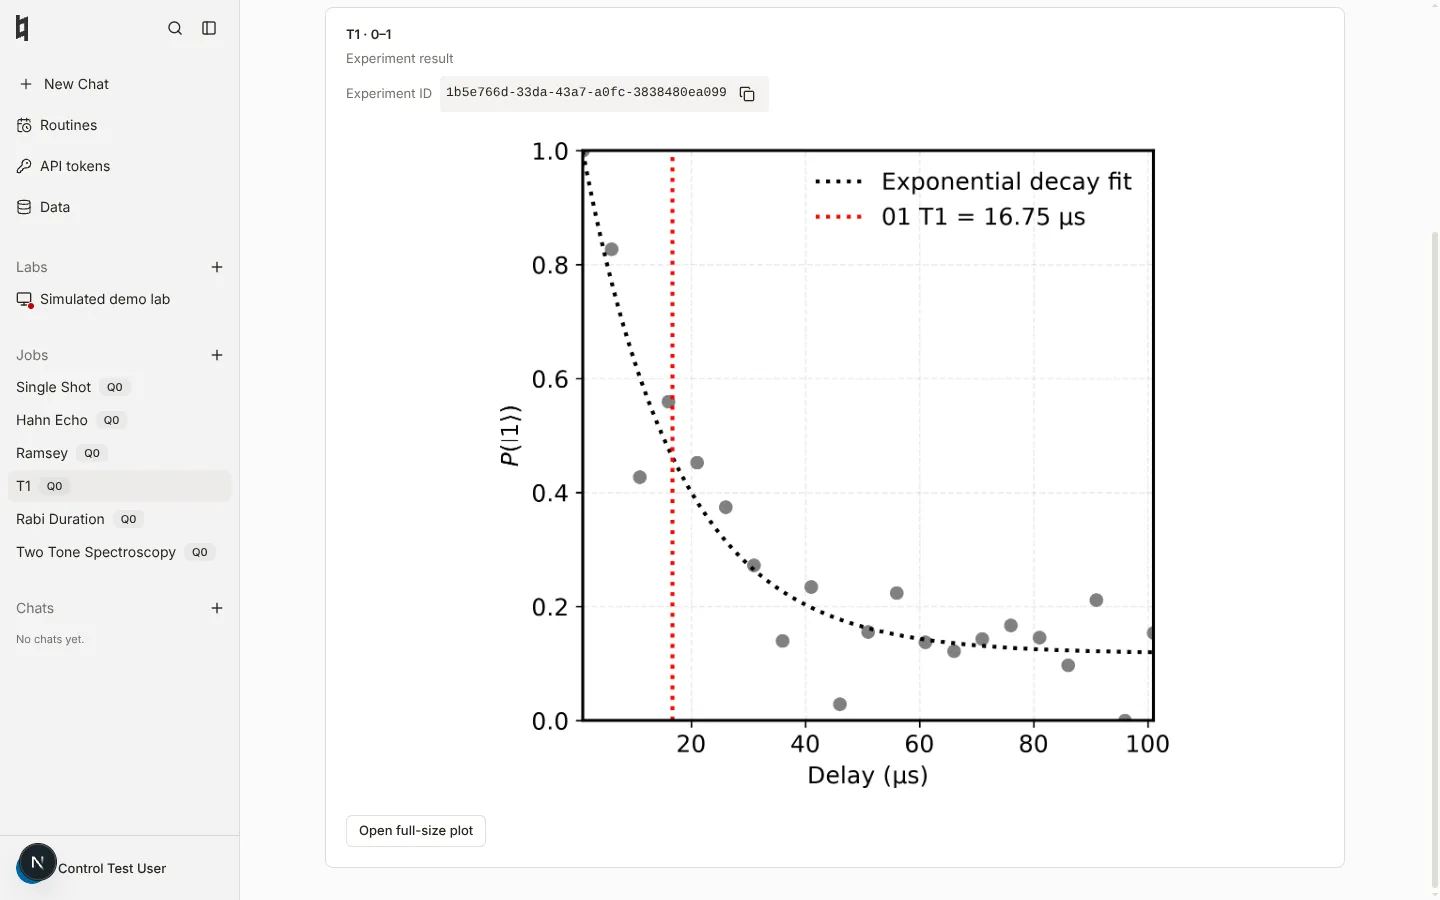
For example, run T1 to measure energy relaxation, Ramsey to characterize dephasing, or Rabi Duration to sweep the drive-pulse duration. Control runs the selected experiment and saves its plots and analysis for inspection. Use this path to investigate one property or test a setting without launching a full calibration workflow.
Your own code directly to instruments
Choose this path when you already have instrument-control code, a notebook, or a custom measurement you want to keep using. Run it from your own computer with the same supported native instrument client and protocol. You do not need to rewrite the measurement as a Control workflow or template.
After connecting your computer, change the instrument IP address in your code to the local endpoint provided by Conductor. Get that endpoint with:
Use the connection’s proxy_host (normally 127.0.0.1) and proxy_port. If the allocated local port differs from the instrument’s original port, update the port in your client connection too. The measurement logic stays the same; the connection address changes. Keep the native client and protocol appropriate for that configured instrument—an XML-RPC client and a gRPC client are not interchangeable.
For example, an existing QubiC XML-RPC client can connect using the printed local port, supplied as its first command-line argument:
First complete lab membership and instrument authorization, approve conductor login --profile user, and keep that profile running. Contact Conductor Quantum Admins if your authorized instruments are unavailable. Changing the IP address does not bypass access permissions or hardware safety limits. Your code controls the measurement and its output; the managed job/results instructions below apply to workflows and templated experiments submitted through Control.
Run a job
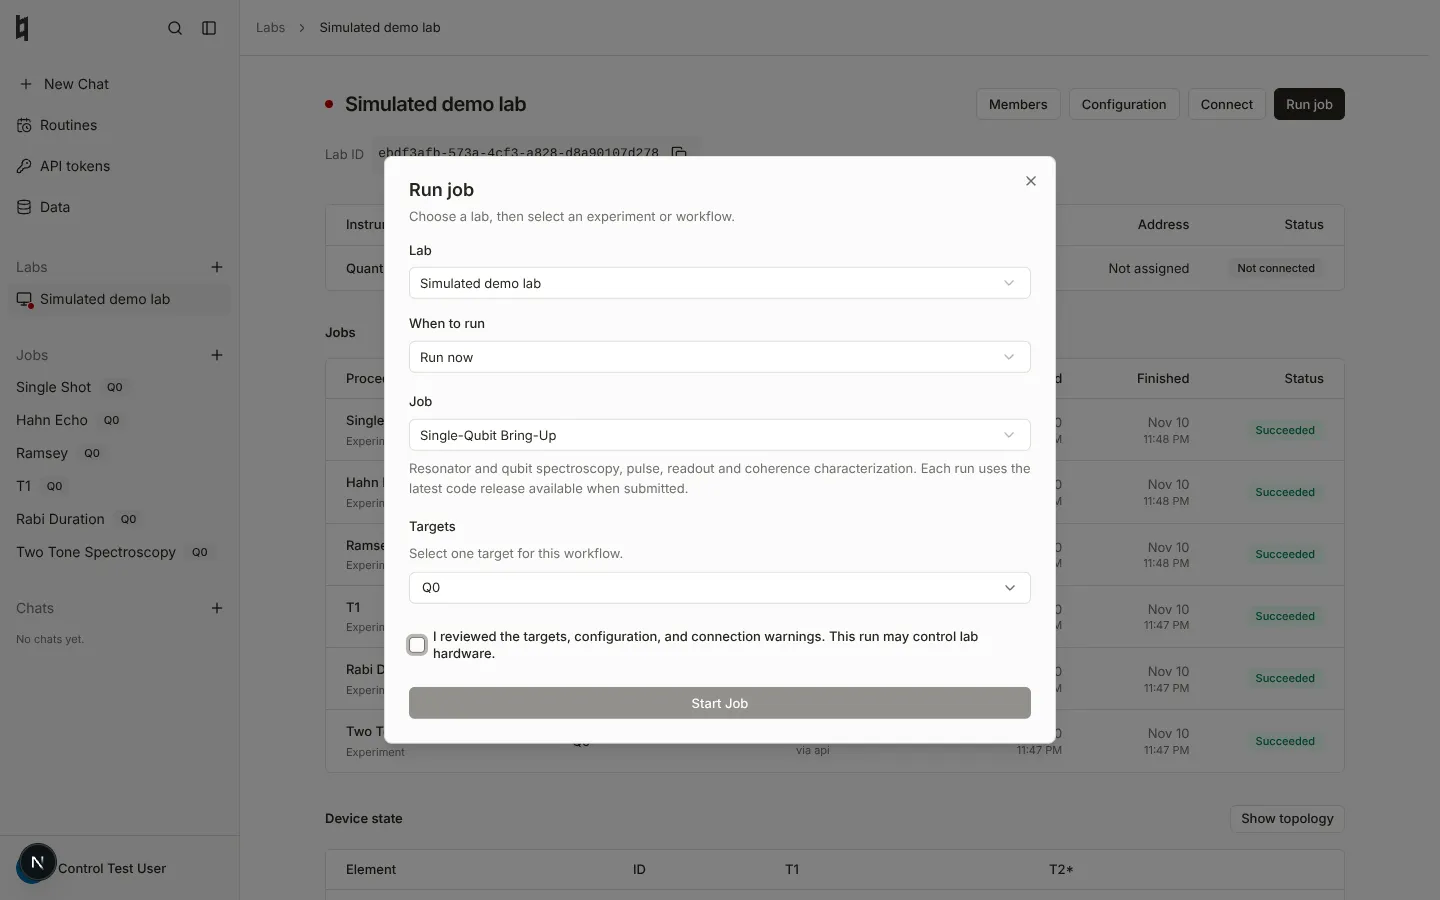
Use the Control job form for workflows and templated experiments:
- Open Run job in the Control sidebar and choose your lab.
- Select an available experiment or workflow, choose its targets, and fill in the experiment settings. The catalog depends on the lab’s configuration and supported hardware.
- Review the targets, active configuration, and connection warnings. Resolve any blockers and confirm the hardware acknowledgement.
- Select Start Job and open the job to follow its status and results.
A job can operate real hardware. Check the selected targets, parameter values, and safe operating limits before submitting. Do not retry an interrupted hardware command blindly: inspect its recorded outcome first, since interruption does not prove the instrument did nothing.
Read the results
Open View results from a lab job, or select a recent job in the sidebar. Saved plots are available for successful, failed, and cancelled runs, including plots saved before a failure. A run that finishes executing but fails scientific acceptance is shown as Failed, not as a successful calibration.
Open Data to browse experiment records, then select an experiment to inspect its plots, analysis, and device-state changes. Copy its experiment or calibration ID when reporting a problem. Check the recorded device-state changes rather than assuming that a successful measurement applied a calibration.
If a job fails, read its error and any saved diagnostics before trying again. A failure before acquisition may have no plots, and a storage or process failure can prevent final evidence from being saved. If a private plot preview expires, refresh the page.
Schedule a routine
Scheduling is a timing option for a workflow or templated experiment, not a fourth type of work or a way to upload arbitrary instrument-control code.
Use Save a scheduled routine in the job form to reuse an experiment or existing workflow. Give it a name, choose hourly, daily, or weekly repeats, and set a future first run in your local time.
Routines are saved paused. Their author enables them from Routines, after reviewing the current configuration, connection checks, and recurring hardware-access acknowledgement. The page shows schedule timestamps in UTC. Repeats use elapsed intervals: daily means every 24 hours, not a fixed local clock time across daylight-saving changes.
- Pause a routine to stop future submissions. This does not cancel a job that is already queued or running; cancel that job separately.
- If a paused routine’s first run has passed, enabling it makes it due immediately.
- Editing a routine saves it paused again and preserves its job history.
- Each occurrence uses the current active configuration and release, not a frozen copy of the configuration or code from when the routine was created.
Review routines when your lab’s available instruments or experiment settings change. Scheduling does not grant additional hardware permissions.
Resolve connection problems
Check the lab’s Instruments page. If an instrument is unavailable or a health check reports it unreachable, contact Conductor Quantum Admins rather than attempting a run. If your own client cannot connect, confirm your membership and instrument authorization, keep your user profile running against the authorized Control deployment, and use the endpoint printed by conductor connections --profile user.
For help, share the job or experiment ID and the relevant error with your lab manager or Conductor contact. Never share API keys, saved login credentials, or private-network enrollment secrets.