Using the Coulomb Blockade Models

Installation

We recommend using pip, poetry, or uv to install the package.

$pip install conductorquantum

Authentication

The SDK requires an API key for authentication. Sign in and create a new API key. Remember, your API key is your access secret—keep it safe with environment variables.

Using environment variables:

Python
1from dotenv import load_dotenv
2import os
3from conductorquantum import ConductorQuantum
4
5# Load API key from .env file
6load_dotenv()
7TOKEN = os.getenv("CONDUCTOR_API_KEY")
8
9# Initialize client
10client = ConductorQuantum(token=TOKEN)

Or provide the API key directly:

Python
1from conductorquantum import ConductorQuantum
2
3# Initialize client with API key
4client = ConductorQuantum(token="YOUR_API_KEY")

Usage Examples

Using the Coulomb Blockade Classifier

The Coulomb Blockade Classifier is a model that can classify a given current measurement as either in the Coulomb Blockade regime or not.

You can download an example file to follow along with the example:

Python
1from dotenv import load_dotenv
2import os
3import numpy as np
4from conductorquantum import ConductorQuantum
5
6
7# Load API key from .env file
8load_dotenv()
9TOKEN = os.getenv("CONDUCTOR_API_KEY")
10
11# Initialize client
12client = ConductorQuantum(token=TOKEN)
13
14# Load Coulomb blockade data (current measurement)
15data = np.load("coulomb-blockade-classifier-v0.npy") # shape (n, )
16
17# Detect Coulomb blockade peaks
18result = client.models.execute(
19 model="coulomb-blockade-classifier-v0",
20 data=data
21)
22
23# Access the classification result
24is_coulomb_blockade = result.output["classification"]
25print(f"Is Coulomb blockade: {is_coulomb_blockade}")
Output
1Is Coulomb blockade: True

Using the Coulomb Blockade Peak Detector

The Coulomb Blockade Peak Detector is a model that can detect the peaks in a given current measurement.

You can download an example file to follow along with the example:

Python
1from dotenv import load_dotenv
2import os
3import numpy as np
4from conductorquantum import ConductorQuantum
5
6
7# Load API key from .env file
8load_dotenv()
9TOKEN = os.getenv("CONDUCTOR_API_KEY")
10
11# Initialize client
12client = ConductorQuantum(token=TOKEN)
13
14# Load Coulomb blockade data (current measurement)
15data = np.load("coulomb-blockade-peak-detector-v0.npy") # shape (n, )
16
17# Detect Coulomb blockade peaks
18result = client.models.execute(
19 model="coulomb-blockade-peak-detector-v0",
20 data=data
21)
22
23# Access the peak locations (indices)
24peak_indices = result.output["peak_indices"]
25print(f"Detected peaks at: {peak_indices}")
Output
1Detected peaks at: [30, 38, 47, 55, 64, 72, 81, 89, 98]

Plotting the Output

Python
1import matplotlib.pyplot as plt
2
3plt.figure(figsize=(10, 5), dpi=300)
4plt.plot(example_input, 'k-')
5count = 0
6for peak_index in result.output["peak_indices"]:
7 if count == 0:
8 plt.axvline(x=peak_index, color='r', linestyle='--', label='Peaks')
9 elif count > 0:
10 plt.axvline(x=peak_index, color='r', linestyle='--')
11
12
13 count += 1
14plt.xlabel('Voltages (Indices)')
15plt.ylabel('Current (a.u.)')
16plt.legend()
17plt.show()
Coulomb Blockade Peak Detector
Coulomb Blockade Peak Detector v0 Output

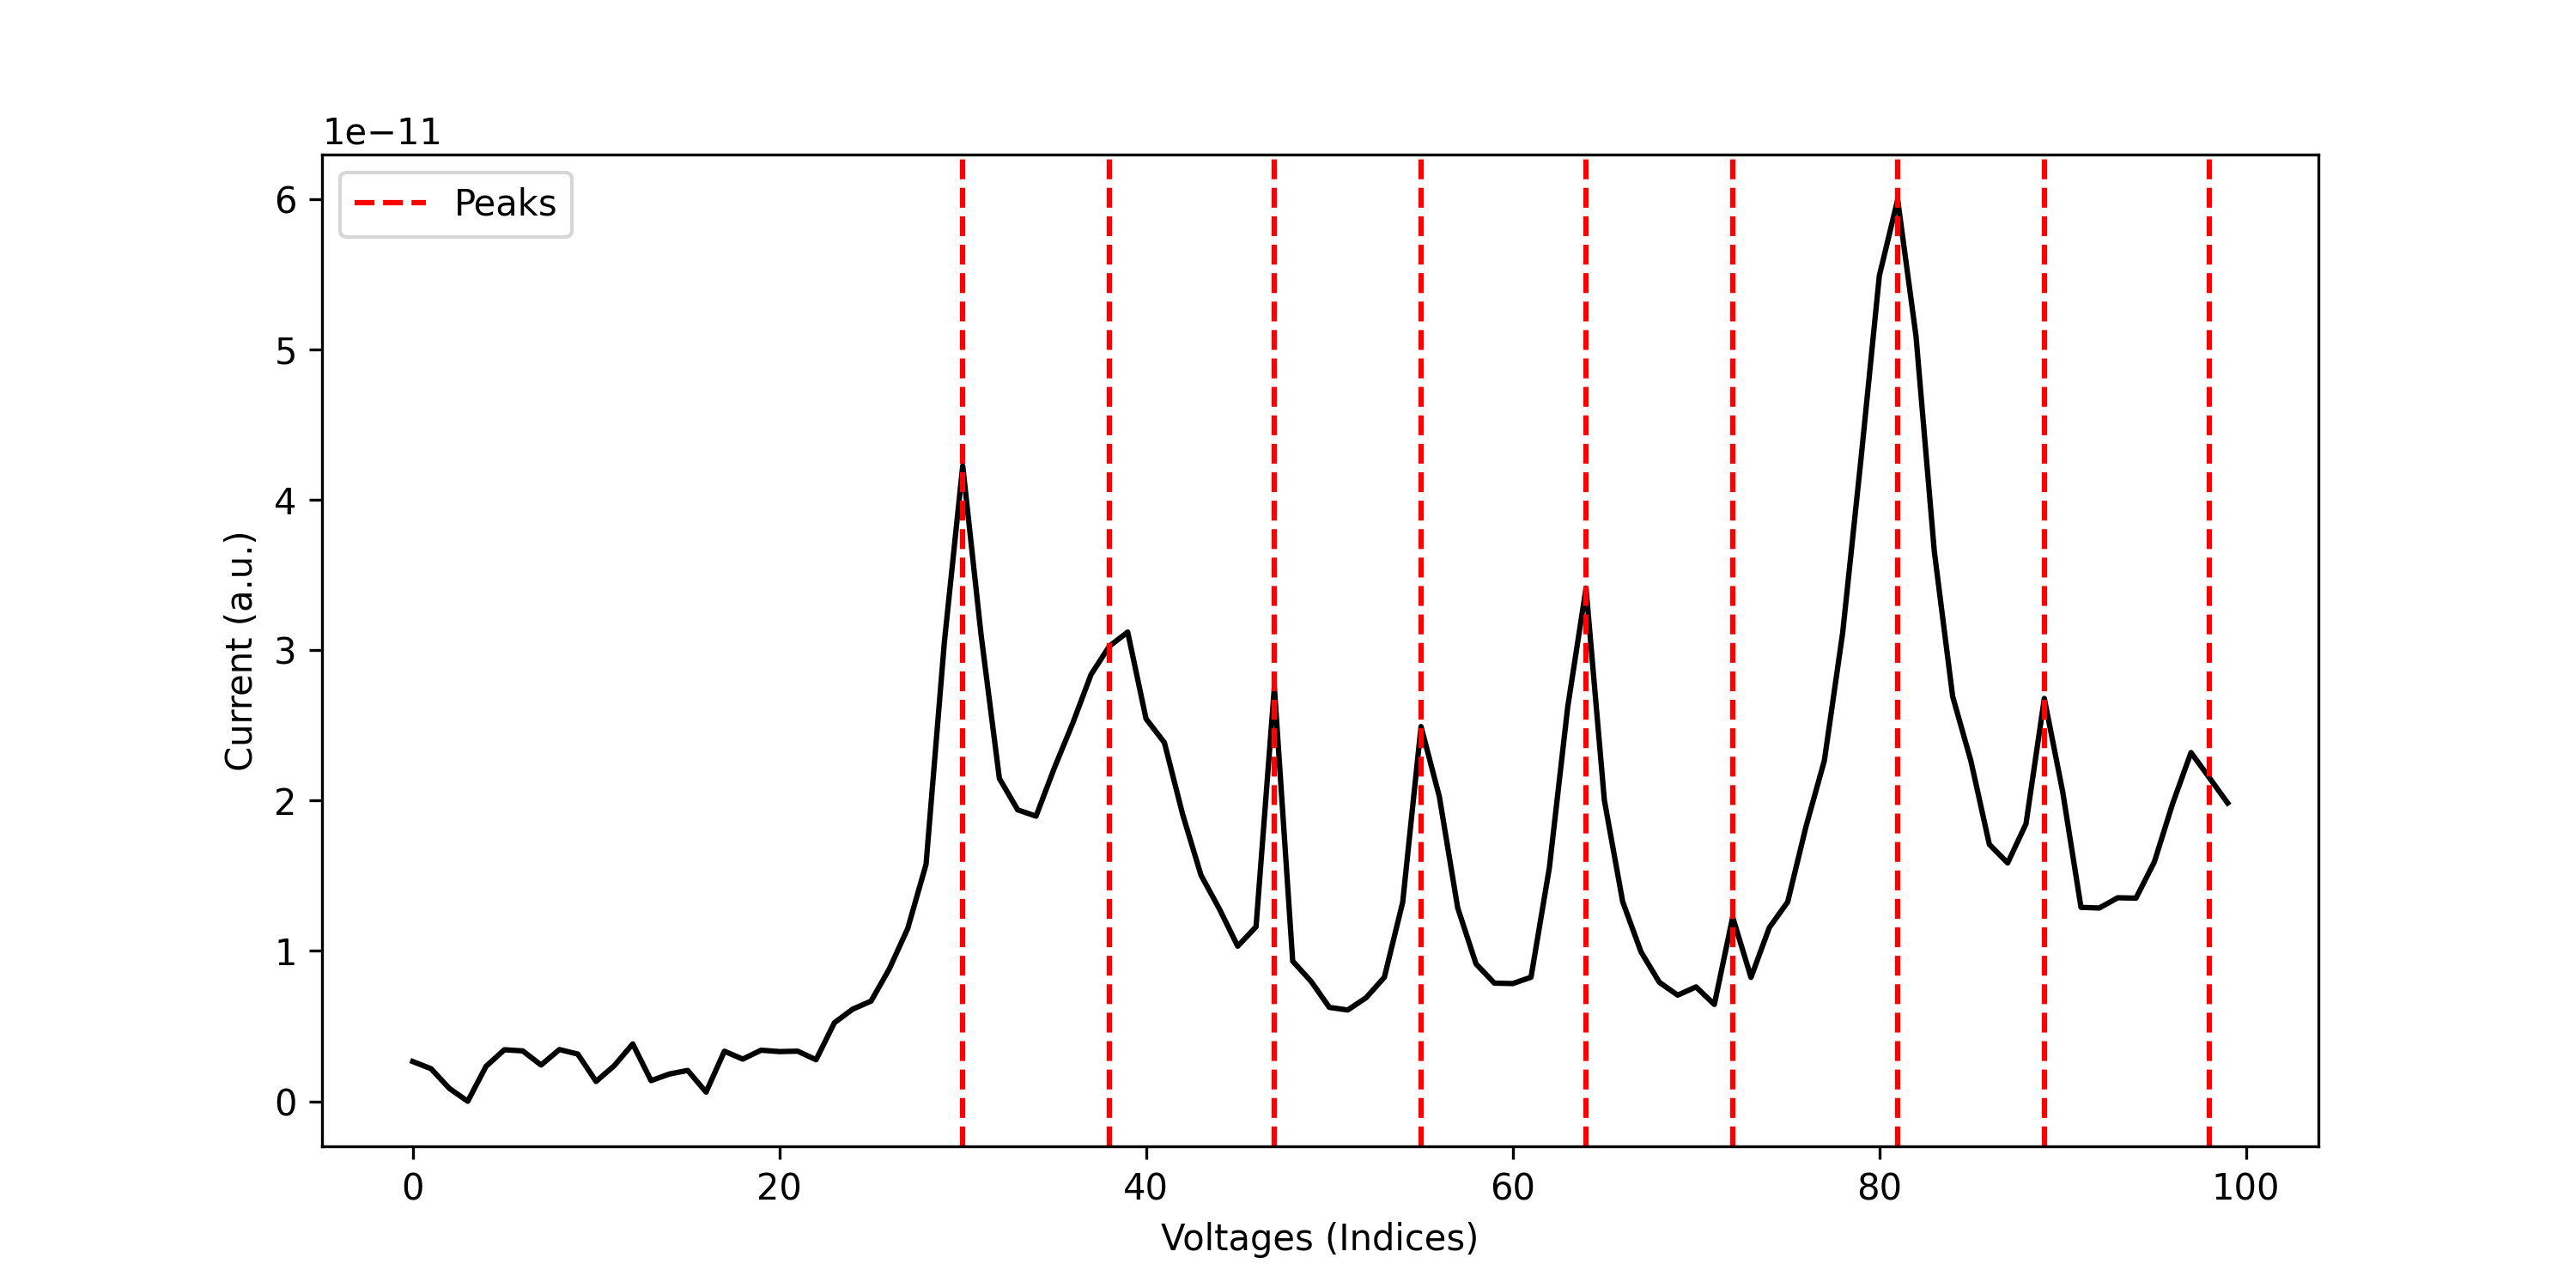
Similarly, for v1 of the Coulomb Blockade Peak Detector, you can download an example file and replace the model name in the example above with coulomb-blockade-peak-detector-v1, and you should see the following output:

Output
1Detected peaks at: [156, 176, 199, 223, 244, 267, 289, 311, 333, 356, 378, 400, 424, 445, 468, 490]
Coulomb Blockade Peak Detector
Coulomb Blockade Peak Detector v1 Output

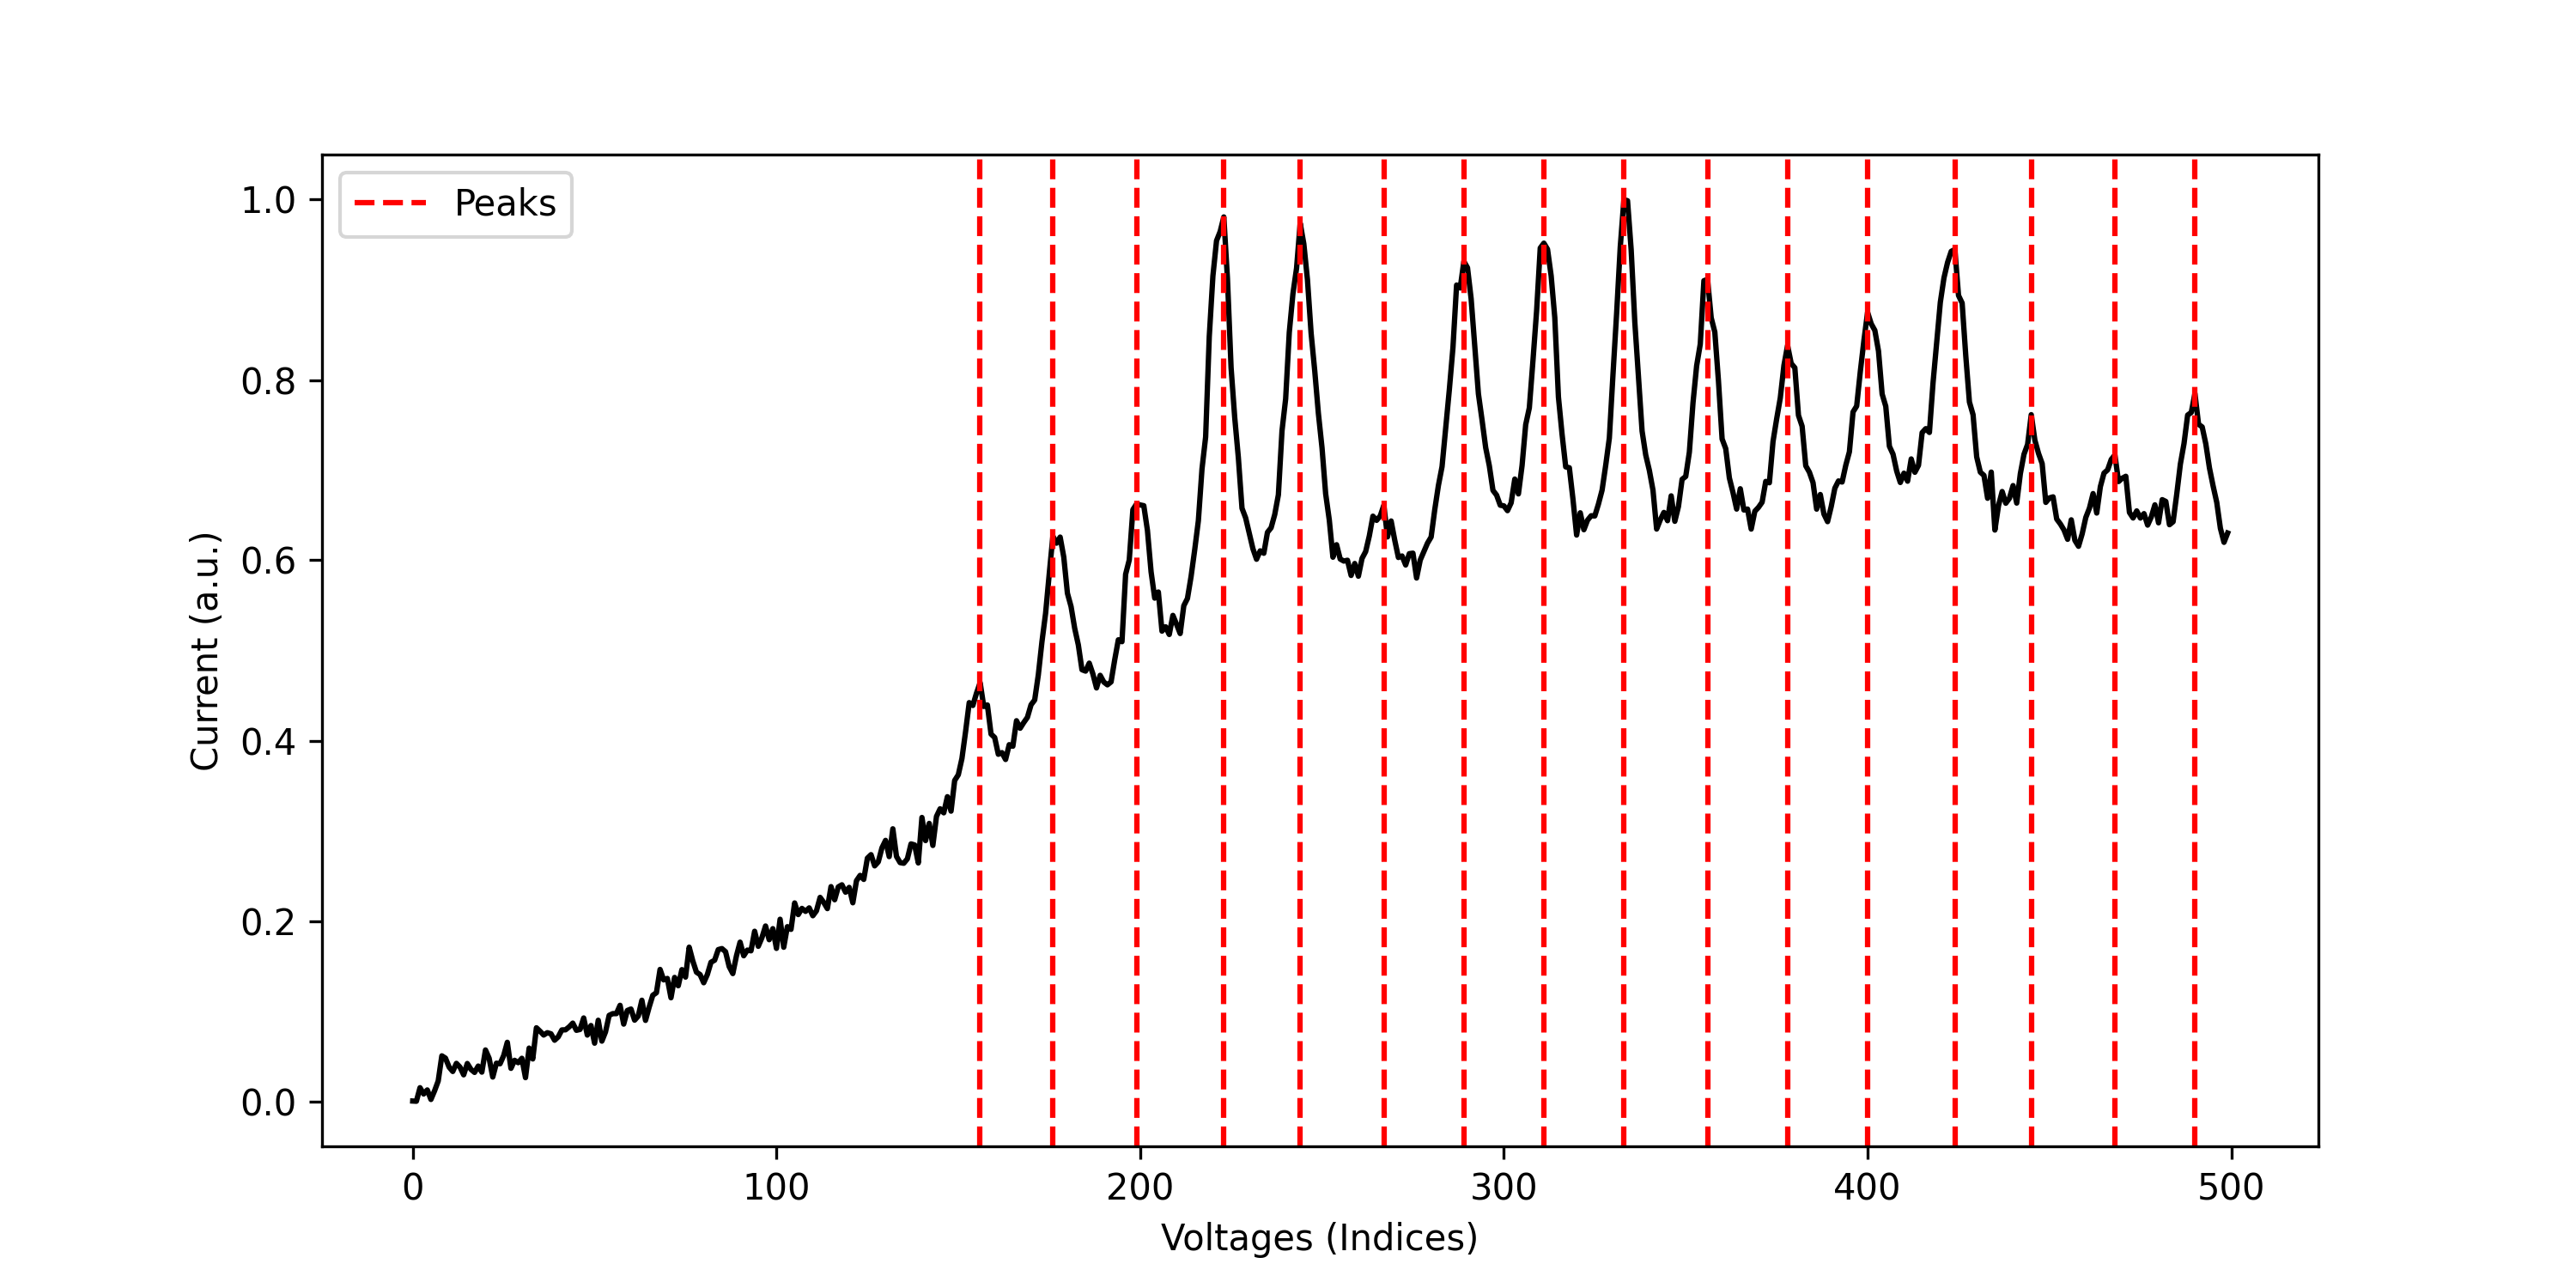
v1 is typically more accurate than v0 for larger sweep sizes of one hundred or more points.

Data Requirements

One-dimensional Current Data

  • Shape: (n, )
  • 1D array of current values

Important Notes for Voltage-Current Data

  • The array must be of shape (n, ) where n is the number of current values in the measurement.
  • Analysis is outputted in terms of indices of the input array.
  • The models automatically handle scaling and normalization internally.
  • For best results, ensure your data has sufficient resolution in regions of interest.