Using Coulomb Diamond Models

Installation

We recommend using pip, poetry, or uv to install the package.

$pip install conductorquantum

Authentication

The SDK requires an API key for authentication. Sign in and create a new API key. Remember, your API key is your access secret—keep it safe with environment variables.

Using environment variables:

Python
1from dotenv import load_dotenv
2import os
3from conductorquantum import ConductorQuantum
4
5# Load API key from .env file
6load_dotenv()
7TOKEN = os.getenv("CONDUCTOR_API_KEY")
8
9# Initialize client
10client = ConductorQuantum(token=TOKEN)

Or provide the API key directly:

Python
1from conductorquantum import ConductorQuantum
2
3# Initialize client with API key
4client = ConductorQuantum(token="YOUR_API_KEY")

Usage Examples

Using the Coulomb Diamond Segmenter

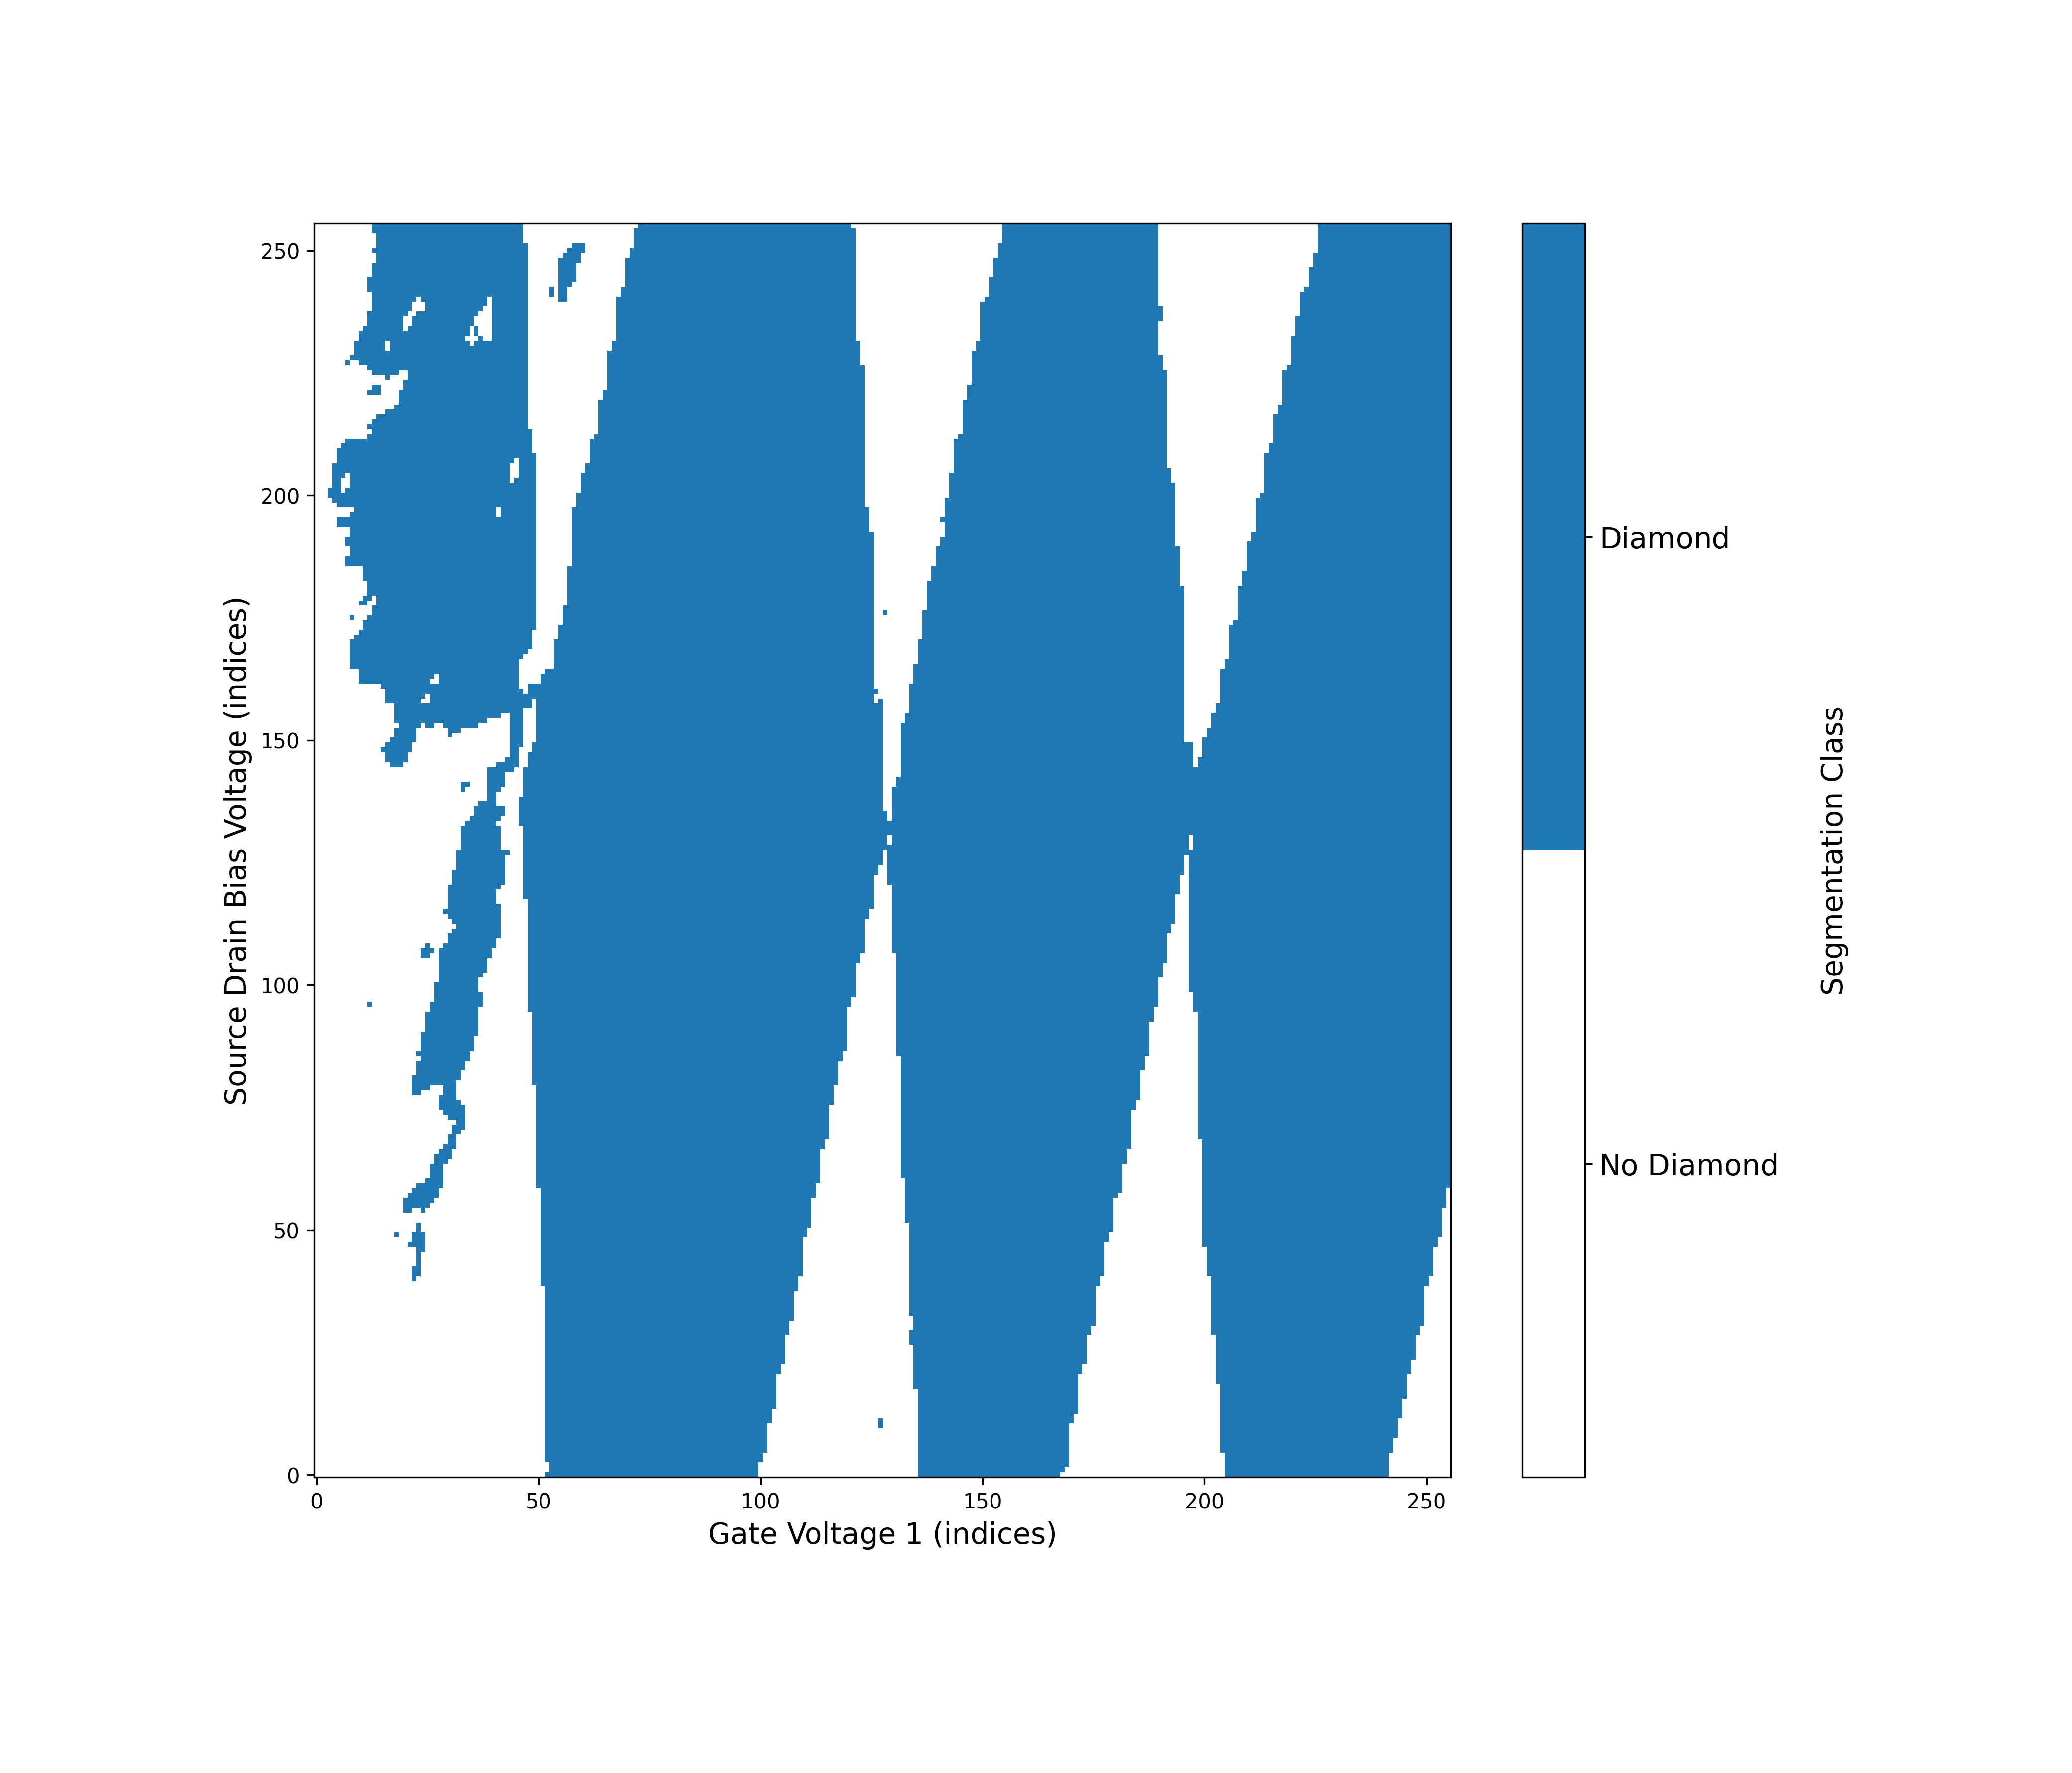
The Coulomb Diamond Segmenter is a binary segmentation model that segments a given conductance measurement grid into coulomb diamond regions.

You can download an example file to follow along with the example:

Python
1from dotenv import load_dotenv
2import os
3import numpy as np
4from conductorquantum import ConductorQuantum
5
6
7# Load API key from .env file
8load_dotenv()
9TOKEN = os.getenv("CONDUCTOR_API_KEY")
10
11# Initialize client
12client = ConductorQuantum(token=TOKEN)
13
14# Load Coulomb Diamond Conductance Grid data
15data = np.load("coulomb-diamond-segmenter-v0.npy") # shape (N, M)
16
17# Segment the Coulomb Diamond Conductance Grid
18result = client.models.execute(
19 model="coulomb-diamond-segmenter-v0",
20 data=data
21)
22
23# Access the binary segmentation mask result
24segmentation_mask = result.output["segmentation"]
25segmentation_mask_array = np.array(segmentation_mask)
26
27# Get non-zero indices: assume shape is (1, H, W)
28nonzero_coords = np.argwhere(binary_mask_array)
29coords_2d = [tuple(coord[1:]) for coord in nonzero_coords]
30
31# Format output
32summary = ", ".join(str(t) for t in coords_2d[:10])
33if len(coords_2d) > 10:
34 summary += f", ... (total {len(coords_2d)} non-zero pixels)"
35print(f"Coulomb Diamond regions at: {summary}")
Segmenter Output
1Coulomb Diamond regions at: (0, 52), (0, 53), (0, 54), (0, 55), (0, 56), (0, 57), (0, 58), (0, 59), (0, 60), (0, 61), ... (total 47046 non-zero pixels)
Coulomb Diamond Segmenter Input Data

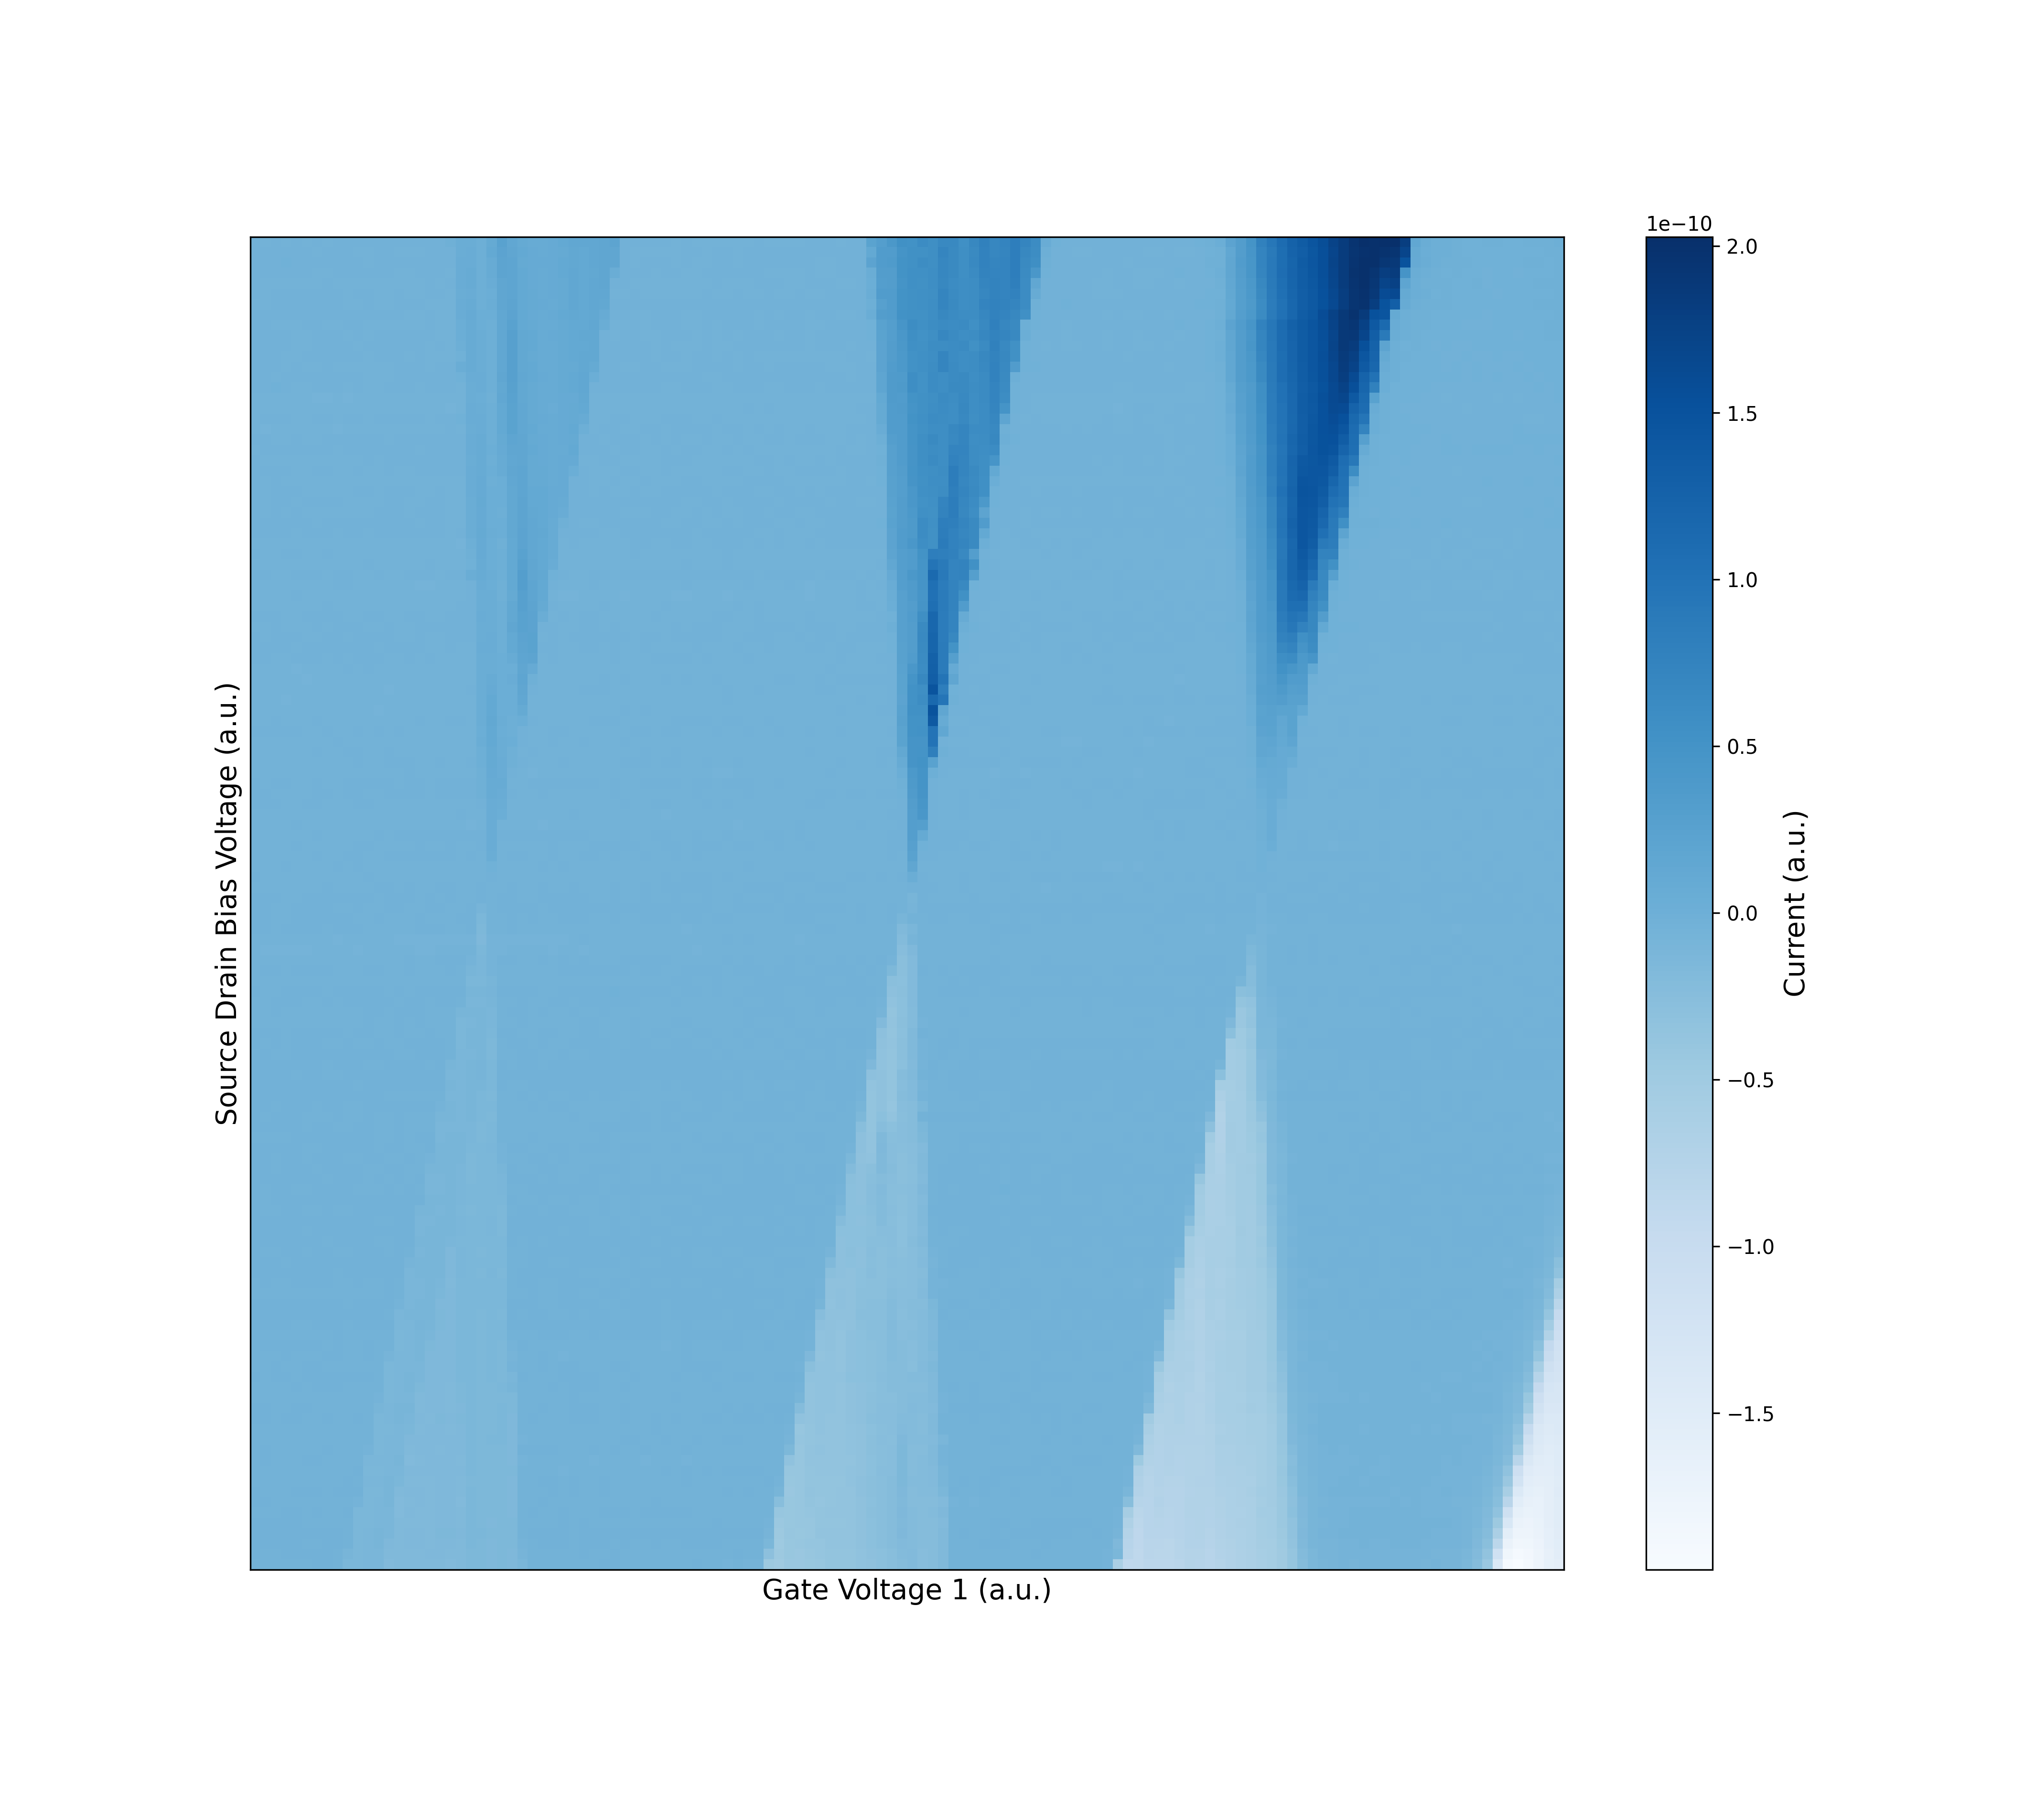
Coulomb Diamond Segmenter v0 Input Data. (Data Source: Lennon, D., et al. Real measurement of Coulomb diamonds. 2019. Zenodo, https://doi.org/10.5281/zenodo.2559478.)

Coulomb Diamond Segmenter
Coulomb Diamond Segmenter v0 Output

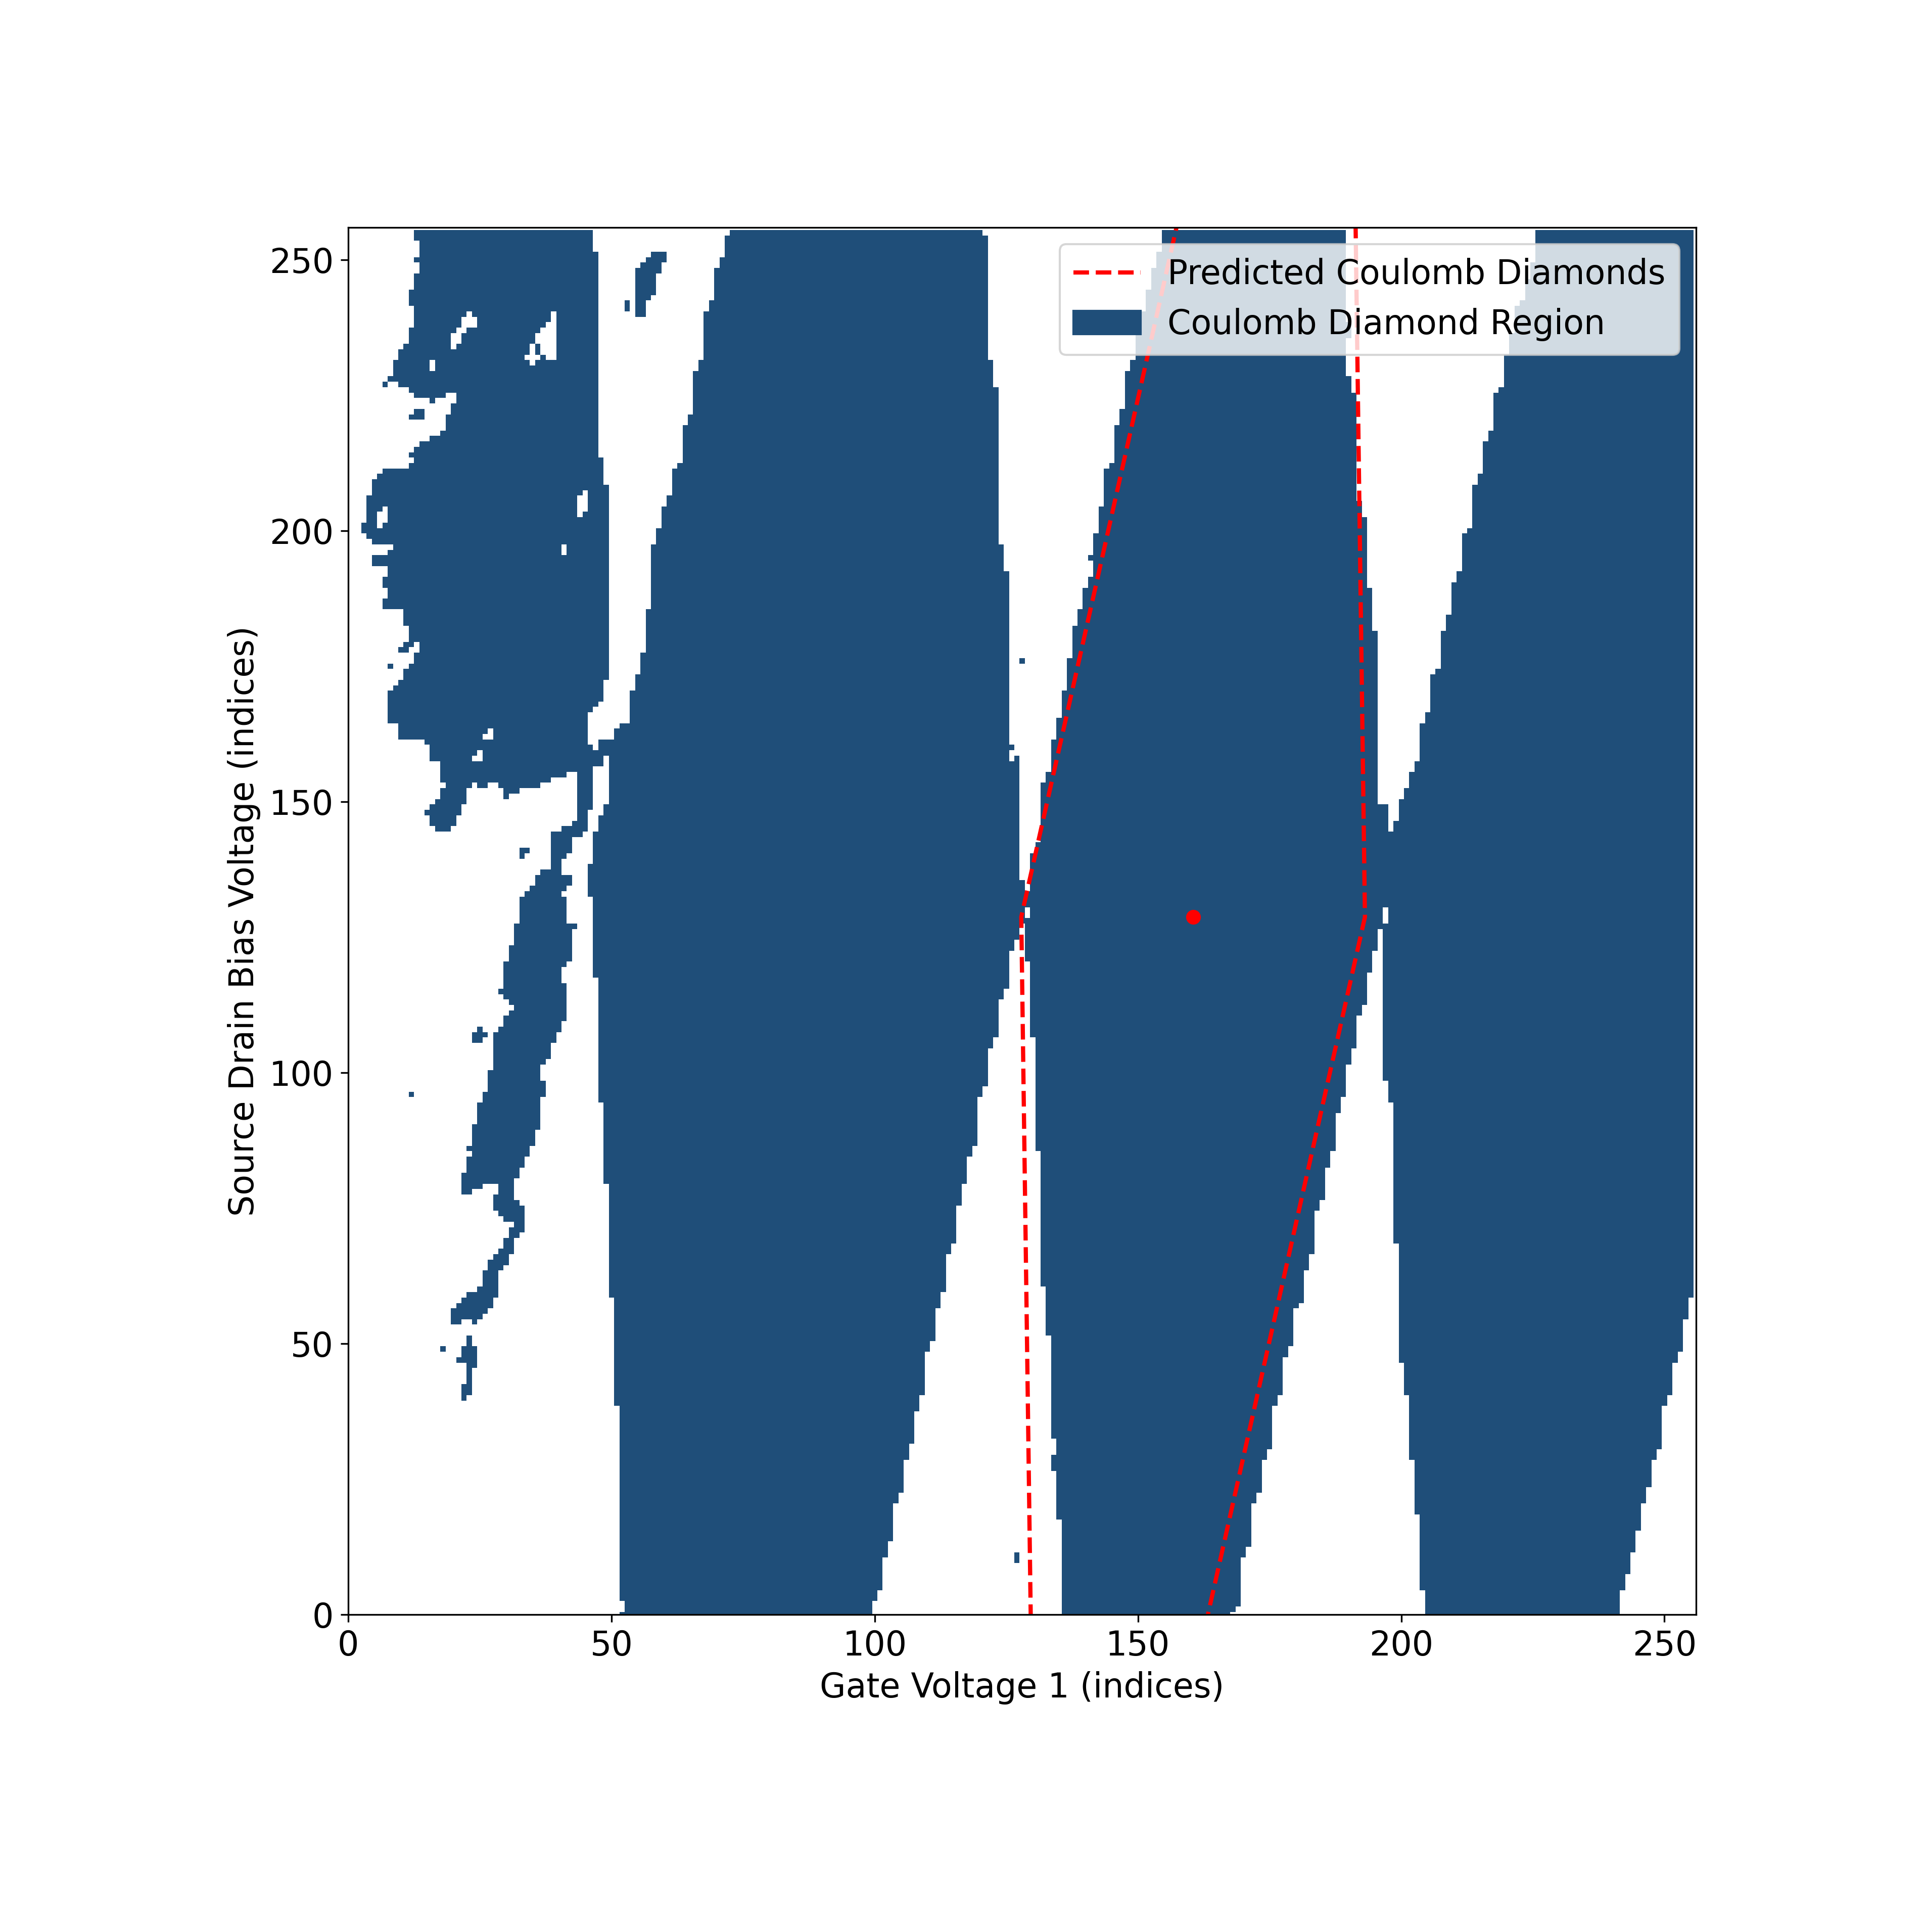
Using the Coulomb Diamond Detector

The Coulomb Diamond Detector is a model that detects Coulomb Diamond structures from a binary segmentation mask.

You can download an example file to follow along with the example:

Python
1from dotenv import load_dotenv
2import os
3import json
4import numpy as np
5from conductorquantum import ConductorQuantum
6
7
8# Load API key from .env file
9load_dotenv()
10TOKEN = os.getenv("CONDUCTOR_API_KEY")
11
12# Initialize client
13client = ConductorQuantum(token=TOKEN)
14
15# Load Coulomb Diamond Detection data
16detection_data = np.load("coulomb-diamond-detector-v0.npy") # shape (n, m)
17
18# Detect diamond structures via the Coulomb Diamond Detector
19result = client.models.execute(
20 model="coulomb-diamond-detector-v0",
21 data=detection_data
22)
23
24# Access the diamond vertices result
25diamond_vertices = result.output["diamond_vertices"]
26print(f"Diamond Vertices: {json.dumps(diamond_vertices, indent=2)}")
Detector Output
1Diamond Vertices: [
2 {
3 "left": [
4 127.83405292034149,
5 128.76852416992188
6 ],
7 "right": [
8 193.11397564411163,
9 128.75509643554688
10 ],
11 "bottom": [
12 131.53489315509796,
13 -137.0048828125
14 ],
15 "top": [
16 189.41313540935516,
17 394.52850341796875
18 ]
19 }
20]

The four diamond keys “left”, “right”, “bottom” and “top” correspond to each vertex of the detected Coulomb diamond.

Plotting the Output

Use the following script to visualize detected coulomb diamonds.

Python
1from matplotlib import pyplot as plt
2from matplotlib.colors import ListedColormap
3
4fig, ax = plt.subplots(figsize=(5, 5))
5
6colors = ["white", "#1f4e79"]
7cmap = ListedColormap(colors)
8
9ax.imshow(detection_data, cmap=cmap, aspect="auto", origin="lower")
10
11for i, diamond in enumerate(diamond_vertices):
12 x_coords = [
13 diamond["top"][0],
14 diamond["right"][0],
15 diamond["bottom"][0],
16 diamond["left"][0],
17 diamond["top"][0],
18 ]
19 y_coords = [
20 diamond["top"][1],
21 diamond["right"][1],
22 diamond["bottom"][1],
23 diamond["left"][1],
24 diamond["top"][1],
25 ]
26
27 if i == 0:
28 ax.plot(
29 x_coords,
30 y_coords,
31 "r--",
32 linewidth=2,
33 label="Predicted Coulomb Diamonds",
34 )
35 else:
36 ax.plot(x_coords, y_coords, "r--", linewidth=2)
37
38 center_x = (diamond["top"][0] + diamond["bottom"][0]) / 2
39 center_y = (diamond["top"][1] + diamond["bottom"][1]) / 2
40 ax.plot(center_x, center_y, "ro", markersize=6)
41
42ax.fill_between([0, 0], [0, 0], color="#1f4e79", label="Coulomb Diamond Region")
43ax.set_xlabel("Gate Voltage 1 (indices)", fontsize=12)
44ax.set_ylabel("Gate Voltage 2 (indices)", fontsize=12)
45
46plt.show()
Coulomb Diamond Detector
Coulomb Diamond Segmenter v0 ➞ Coulomb Diamond Detector v0 Output

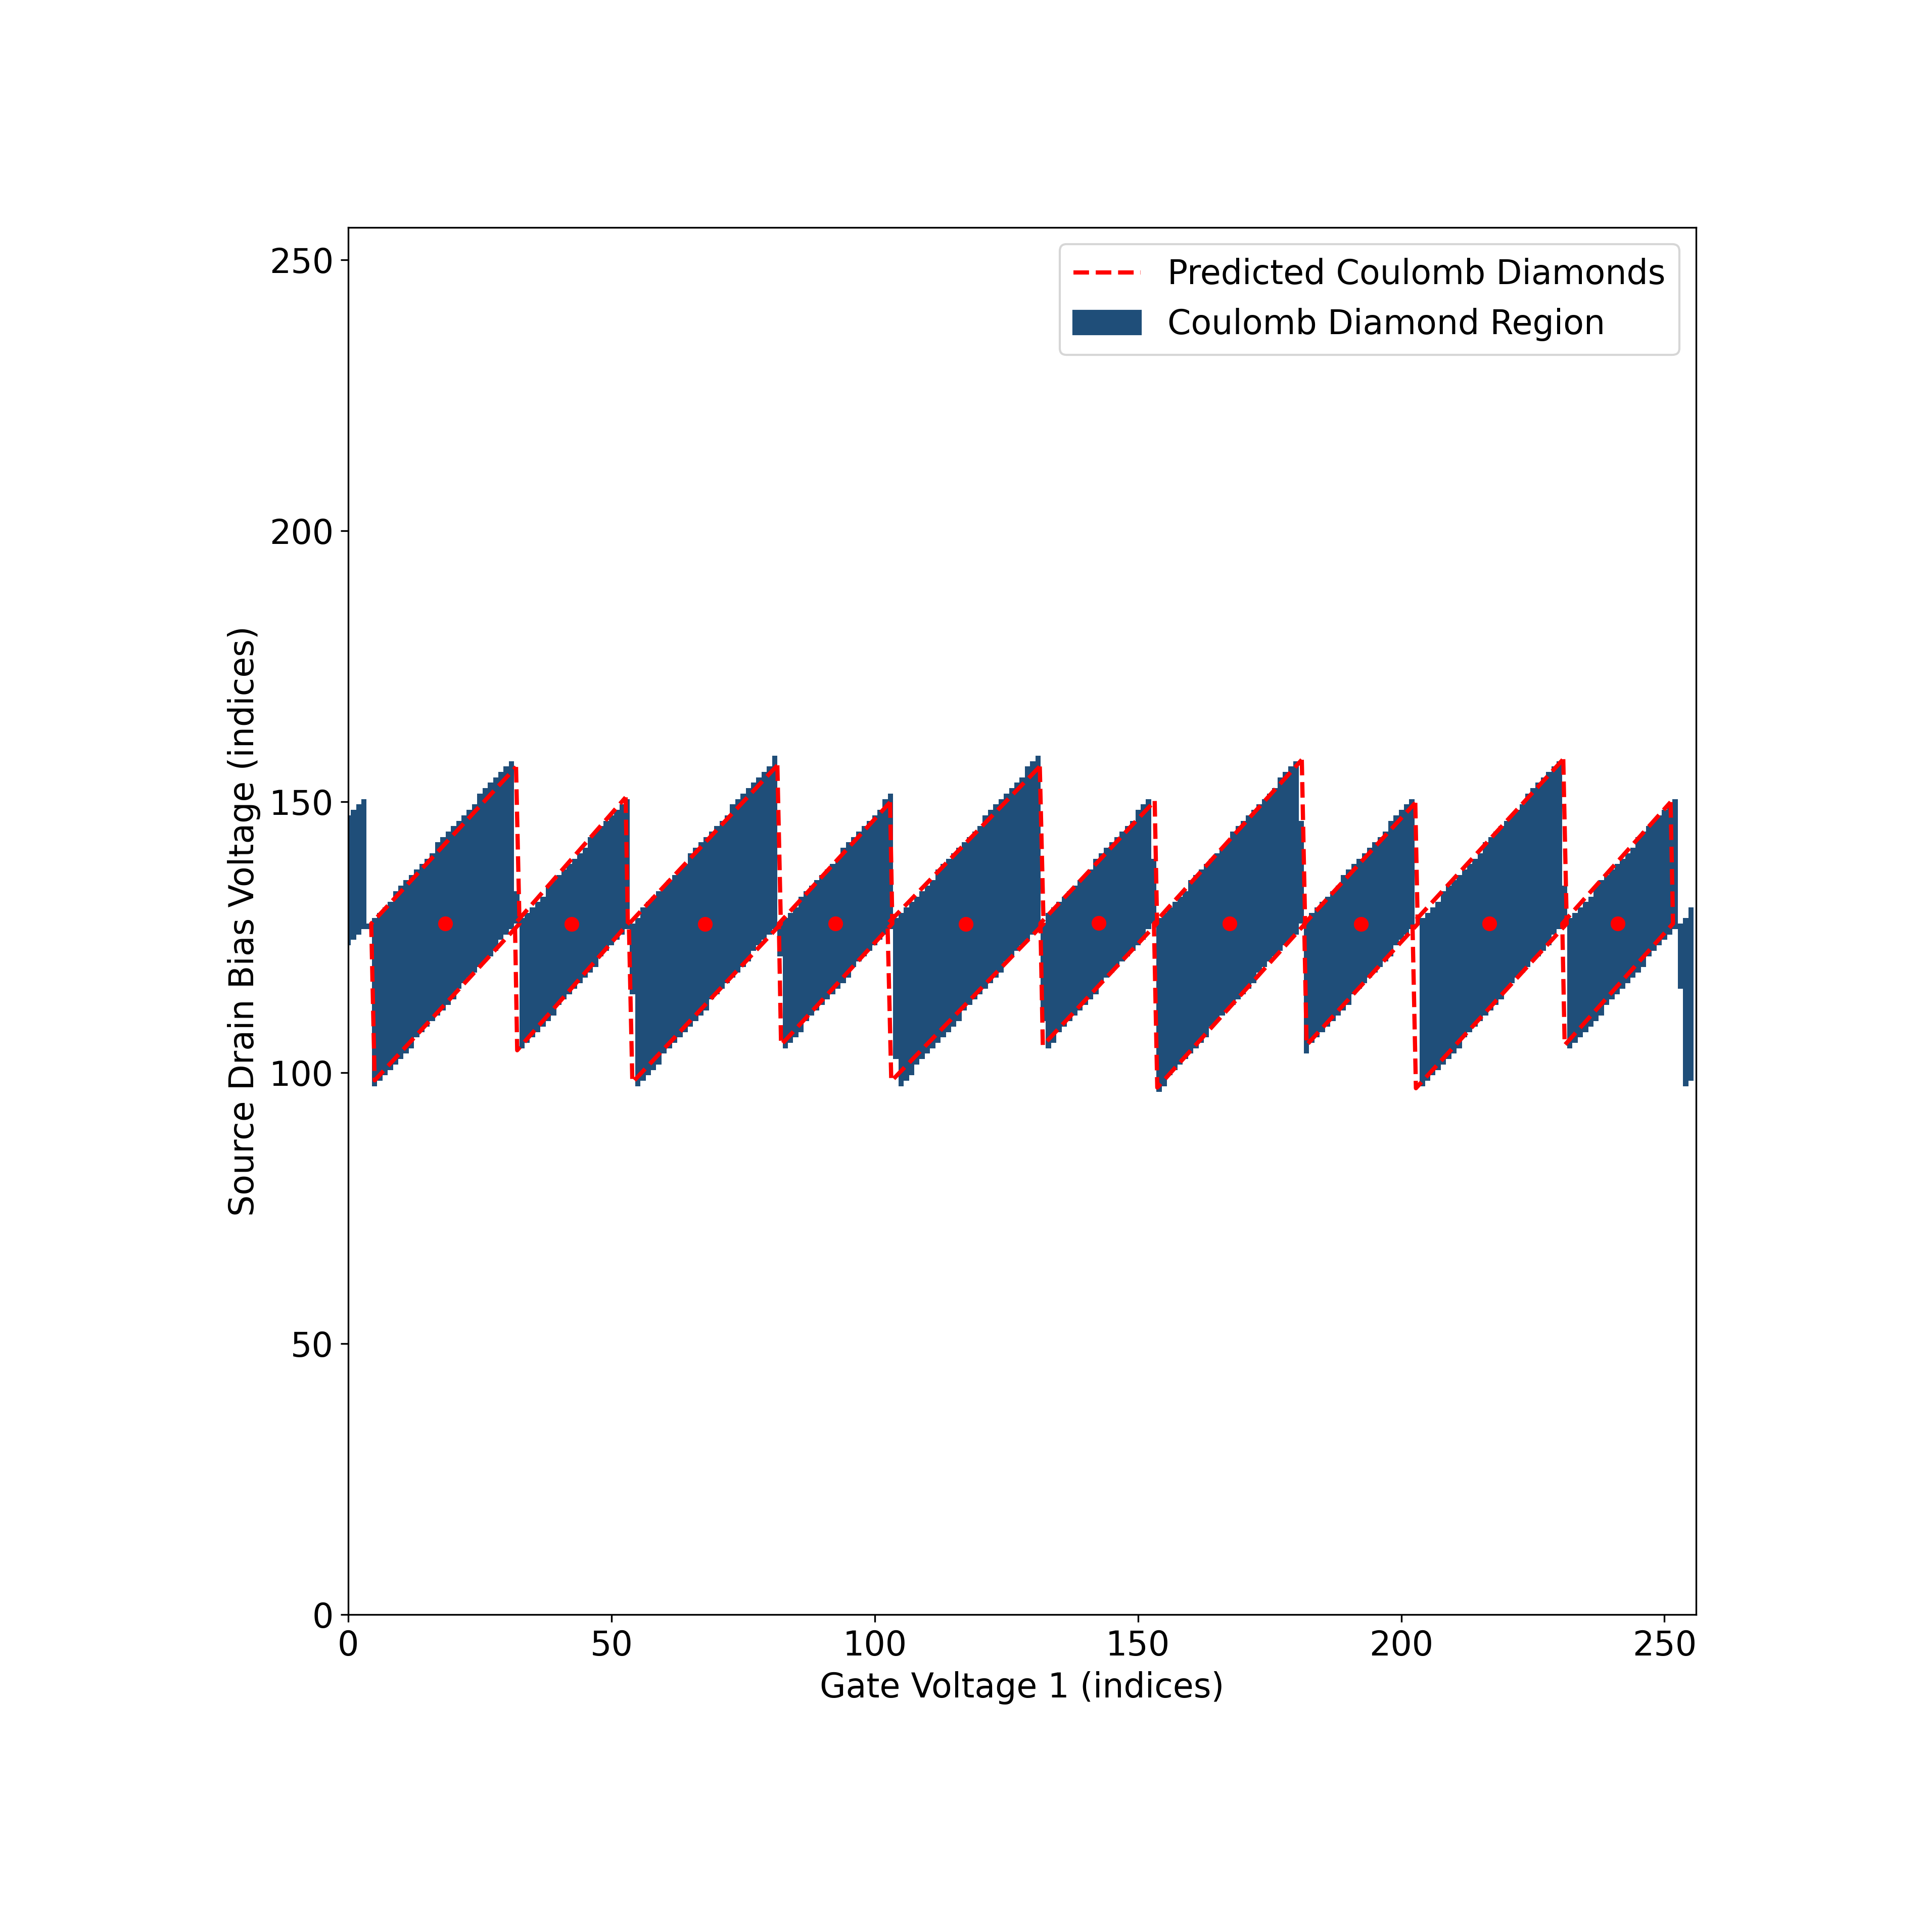
The Coulomb Diamond Detector can detect multiple coulomb diamonds. Download the following example to try it.

Coulomb Diamond Detector
Coulomb Diamond Detector v0 Output

Important Notes for Coulomb Diamond Data

  • The Coulomb Diamond Segmenter’s inference input can be any arbitrary size (n, m), but will upscale the image to (256, 256) if it is smaller than 256x256 px.
  • The Coulomb Diamond Detector’s inference input can be any arbitrary size (n, m), but will upscale the image to (256, 256) if it is smaller than 256x256 px.
  • The Coulomb Diamond Segmenter and Detector can be used sequentially to detect coulomb diamond vertices of a 2D conductance grid.
  • Diamond vertices outputs will be in pixel coordinates.