Using the Resonator Dip Finder

The Resonator Dip Finder detects resonator dips in 1D spectroscopy magnitude traces. It works with any input scale (dB, linear, or arbitrary units) through automatic normalization.

This model is useful during quantum device characterization when measuring resonator transmission to identify resonance frequencies. It accepts magnitude data from any scattering parameter measurement (e.g. S11, S21, S12, S22) and returns the indices of detected dips in the input data.

Installation

We recommend using pip, poetry, or uv to install the package.

$pip install conductorquantum

Authentication

The SDK requires an API key for authentication. Sign in and create a new API key. Remember, your API key is your access secret - keep it safe with environment variables.

Using environment variables:

Python
1from dotenv import load_dotenv
2import os
3from conductorquantum import ConductorQuantum
4
5# Load API key from .env file
6load_dotenv()
7TOKEN = os.getenv("CONDUCTOR_API_KEY")
8
9# Initialize client
10client = ConductorQuantum(token=TOKEN)

Or provide the API key directly:

Python
1from conductorquantum import ConductorQuantum
2
3# Initialize client with API key
4client = ConductorQuantum(token="YOUR_API_KEY")

Input Format

The detector expects a 1D numpy array of shape (n,) where n ≥ 10:

PropertyValue
Type1D numpy array
Shape(n,) where n ≥ 10
ValuesMagnitude data in any scale (dB, linear, arbitrary units)

The model accepts magnitude data from any scattering parameter measurement (S11, S21, S12, S22, etc.). Input values must not contain NaN and must not be constant (all identical values).

Output Format

KeyTypeDescription
dip_indiceslist[int]Indices into the input array where resonator dips were detected. Empty list if no dips are found.

Usage Example

You can download an example file to follow along with the example:

Python
1from dotenv import load_dotenv
2import os
3import numpy as np
4from conductorquantum import ConductorQuantum
5
6
7# Load API key from .env file
8load_dotenv()
9TOKEN = os.getenv("CONDUCTOR_API_KEY")
10
11# Initialize client
12client = ConductorQuantum(token=TOKEN)
13
14# Load spectroscopy magnitude data
15data = np.load("resonator-dip-finder-v0.npy") # shape (n,)
16
17# Detect resonator dips
18result = client.models.execute(
19 model="resonator-dip-finder-v0",
20 data=data,
21)
22
23# Access the detected dip indices
24dip_indices = result.output["dip_indices"]
25print(f"Detected {len(dip_indices)} dips at indices: {dip_indices}")
Output
1Detected 3 dips at indices: [13, 68, 114]

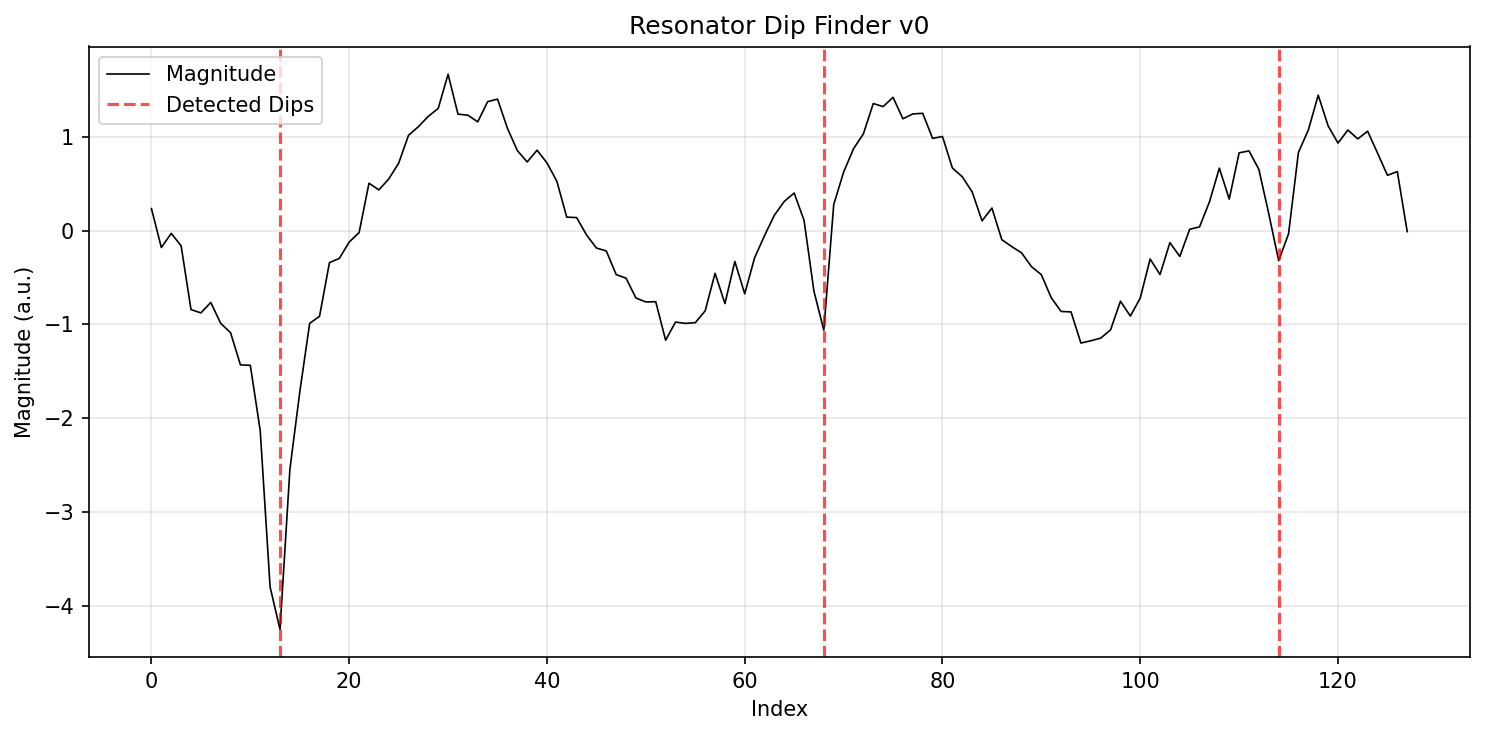
Plotting the Results

Python
1import matplotlib.pyplot as plt
2
3plt.figure(figsize=(10, 5))
4plt.plot(data, 'k-', linewidth=0.8, label='Magnitude')
5
6for i, idx in enumerate(dip_indices):
7 if i == 0:
8 plt.axvline(x=idx, color='red', linestyle='--', alpha=0.7, label='Detected Dips')
9 else:
10 plt.axvline(x=idx, color='red', linestyle='--', alpha=0.7)
11
12plt.xlabel('Index')
13plt.ylabel('Magnitude (a.u.)')
14plt.title('Resonator Dip Finder v0')
15plt.legend()
16plt.grid(True, alpha=0.3)
17plt.tight_layout()
18plt.show()
Resonator Dip Finder v0 Output
Resonator Dip Finder v0 - detected dips marked with dashed red lines

Using Physical Units

To plot with real frequency values, map the indices back to your frequency axis:

Python
1import matplotlib.pyplot as plt
2import numpy as np
3
4# Your physical frequency axis
5frequencies_ghz = np.linspace(6.8, 7.2, len(data))
6
7plt.figure(figsize=(10, 5))
8plt.plot(frequencies_ghz, data, 'k-', linewidth=0.8, label='Magnitude')
9
10for i, idx in enumerate(dip_indices):
11 if i == 0:
12 plt.axvline(x=frequencies_ghz[idx], color='red', linestyle='--', alpha=0.7, label='Detected Dips')
13 else:
14 plt.axvline(x=frequencies_ghz[idx], color='red', linestyle='--', alpha=0.7)
15
16plt.xlabel('Frequency (GHz)')
17plt.ylabel('Magnitude (a.u.)')
18plt.title('Resonator Dip Finder v0')
19plt.legend()
20plt.grid(True, alpha=0.3)
21plt.tight_layout()
22plt.show()

Important Notes

  • The model accepts any scattering parameter measurement (S11, S21, S12, S22, etc.) - it is not specific to any single scattering parameter.
  • Works with any input scale: dB, linear, or arbitrary units.
  • No fixed input size is required - any 1D array with 10 or more data points is accepted.
  • Returns only dip indices, not frequencies. To convert indices to frequencies, map them back to your frequency axis.
  • Input data must not contain NaN values and must not be constant (all identical values).