
Skip to navigation

Using Coulomb Diamond Models

Installation

We recommend using pip, poetry, or uv to install the package.

pip install conductorquantum

Authentication

The SDK requires an API key for authentication. Sign in and create a new API key. Remember, your API key is your access secret - keep it safe with environment variables.

Using environment variables:

Python
from dotenv import load_dotenv
import os
from conductorquantum import ConductorQuantum
# Load API key from .env file
load_dotenv()
TOKEN = os.getenv("CONDUCTOR_API_KEY")
# Initialize client
client = ConductorQuantum(token=TOKEN)

Or provide the API key directly:

Python
from conductorquantum import ConductorQuantum
# Initialize client with API key
client = ConductorQuantum(token="YOUR_API_KEY")

Usage Examples

Using the Coulomb Diamond Segmenter v0

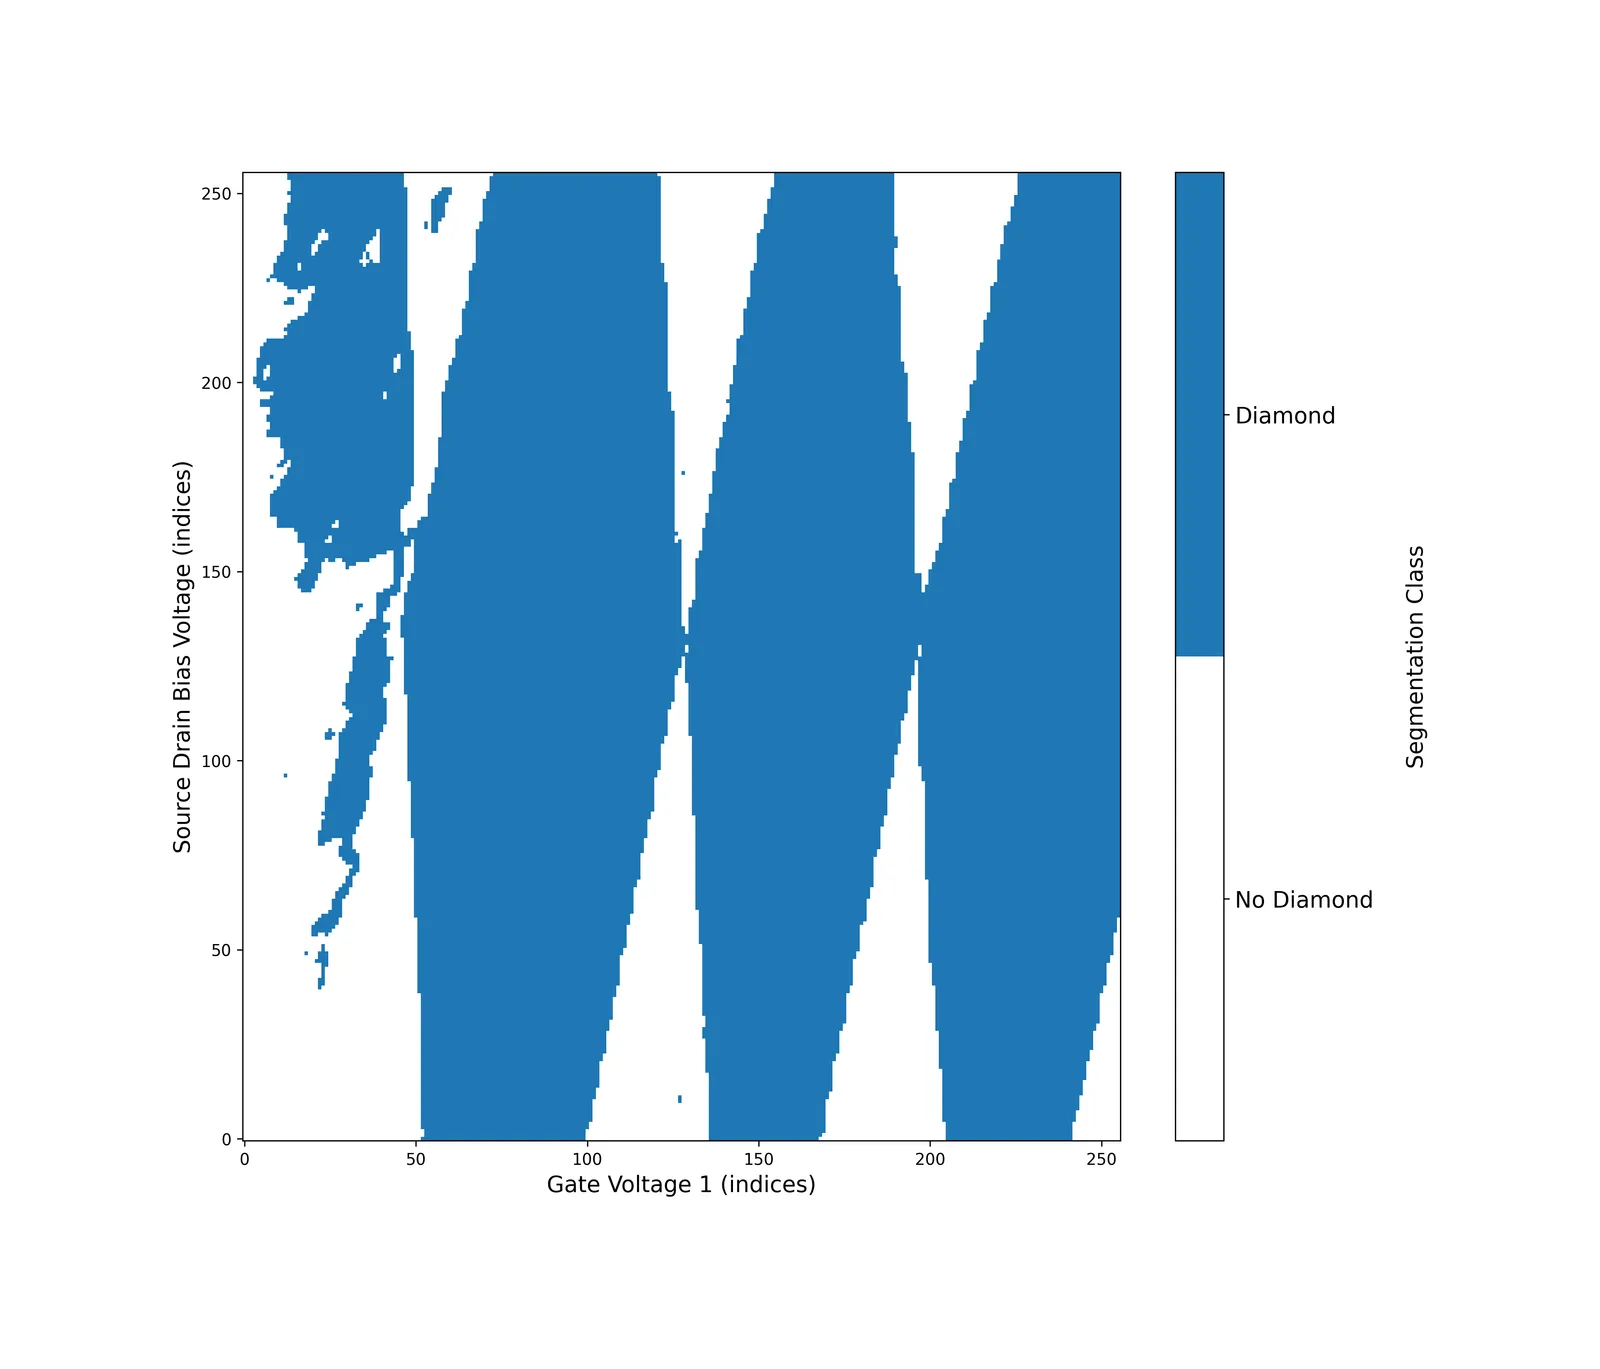
The Coulomb Diamond Segmenter is a binary segmentation model that segments a given conductance measurement grid into coulomb diamond regions.

You can download an example file to follow along with the example:
Python
from dotenv import load_dotenv
import os
import numpy as np
from conductorquantum import ConductorQuantum
# Load API key from .env file
load_dotenv()
TOKEN = os.getenv("CONDUCTOR_API_KEY")
# Initialize client
client = ConductorQuantum(token=TOKEN)
# Load Coulomb Diamond Conductance Grid data
data = np.load("coulomb-diamond-segmenter-v0.npy") # shape (n, m)
# Segment the Coulomb Diamond Conductance Grid
result = client.control.models.run(
model="coulomb-diamond-segmenter-v0",
data=data
)
# Access the binary segmentation mask result
segmentation_mask = result.output["segmentation"]
segmentation_mask_array = np.array(segmentation_mask)
# Get non-zero indices: assume shape is (1, H, W)
nonzero_coords = np.argwhere(segmentation_mask_array)
coords_2d = [tuple(coord[1:]) for coord in nonzero_coords]
# Format output
summary = ", ".join(str(t) for t in coords_2d[:10])
if len(coords_2d) > 10:
summary += f", ... (total {len(coords_2d)} non-zero pixels)"
print(f"Coulomb Diamond regions at: {summary}")
Segmenter Output
Coulomb Diamond regions at: (0, 52), (0, 53), (0, 54), (0, 55), (0, 56), (0, 57), (0, 58), (0, 59), (0, 60), (0, 61), ... (total 47046 non-zero pixels)
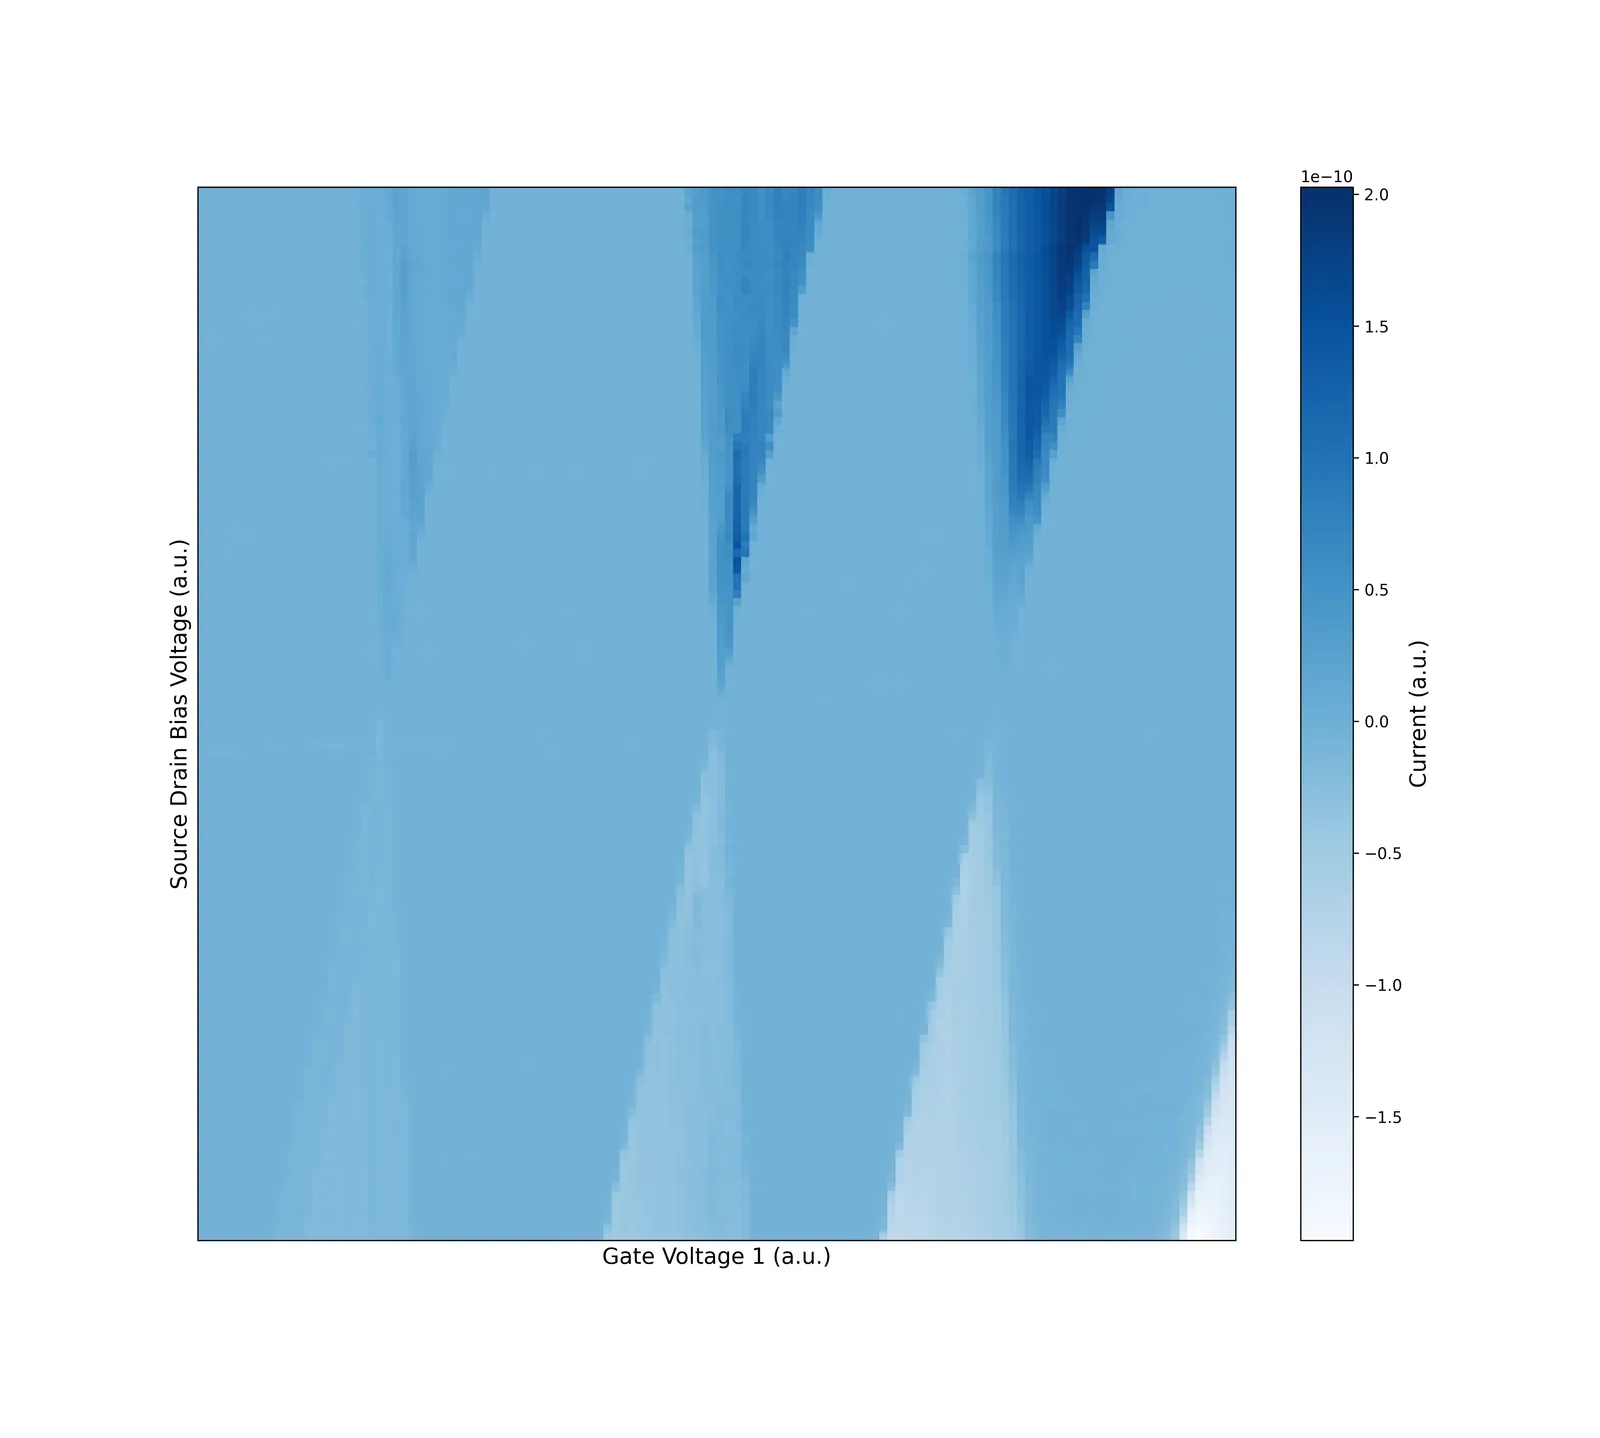
Coulomb Diamond Segmenter Input Data

Coulomb Diamond Segmenter v0 Input Data. (Data Source: Lennon, D., et al. Real measurement of Coulomb diamonds. 2019. Zenodo, https://doi.org/10.5281/zenodo.2559478.)
Coulomb Diamond Segmenter
Coulomb Diamond Segmenter v0 Output

Using the Coulomb Diamond Detector v0

The Coulomb Diamond Detector v0 is a model that detects Coulomb Diamond structures from a binary segmentation mask.

You can download an example file to follow along with the example:

Python
from dotenv import load_dotenv
import os
import json
import numpy as np
from conductorquantum import ConductorQuantum
# Load API key from .env file
load_dotenv()
TOKEN = os.getenv("CONDUCTOR_API_KEY")
# Initialize client
client = ConductorQuantum(token=TOKEN)
# Load Coulomb Diamond Detection data
detection_data = np.load("coulomb-diamond-detector-v0.npy") # shape (n, m)
# Detect diamond structures via the Coulomb Diamond Detector
result = client.control.models.run(
model="coulomb-diamond-detector-v0",
data=detection_data
)
# Access the diamond vertices result
diamond_vertices = result.output["diamond_vertices"]
print(f"Diamond Vertices: {json.dumps(diamond_vertices, indent=2)}")
Detector Output
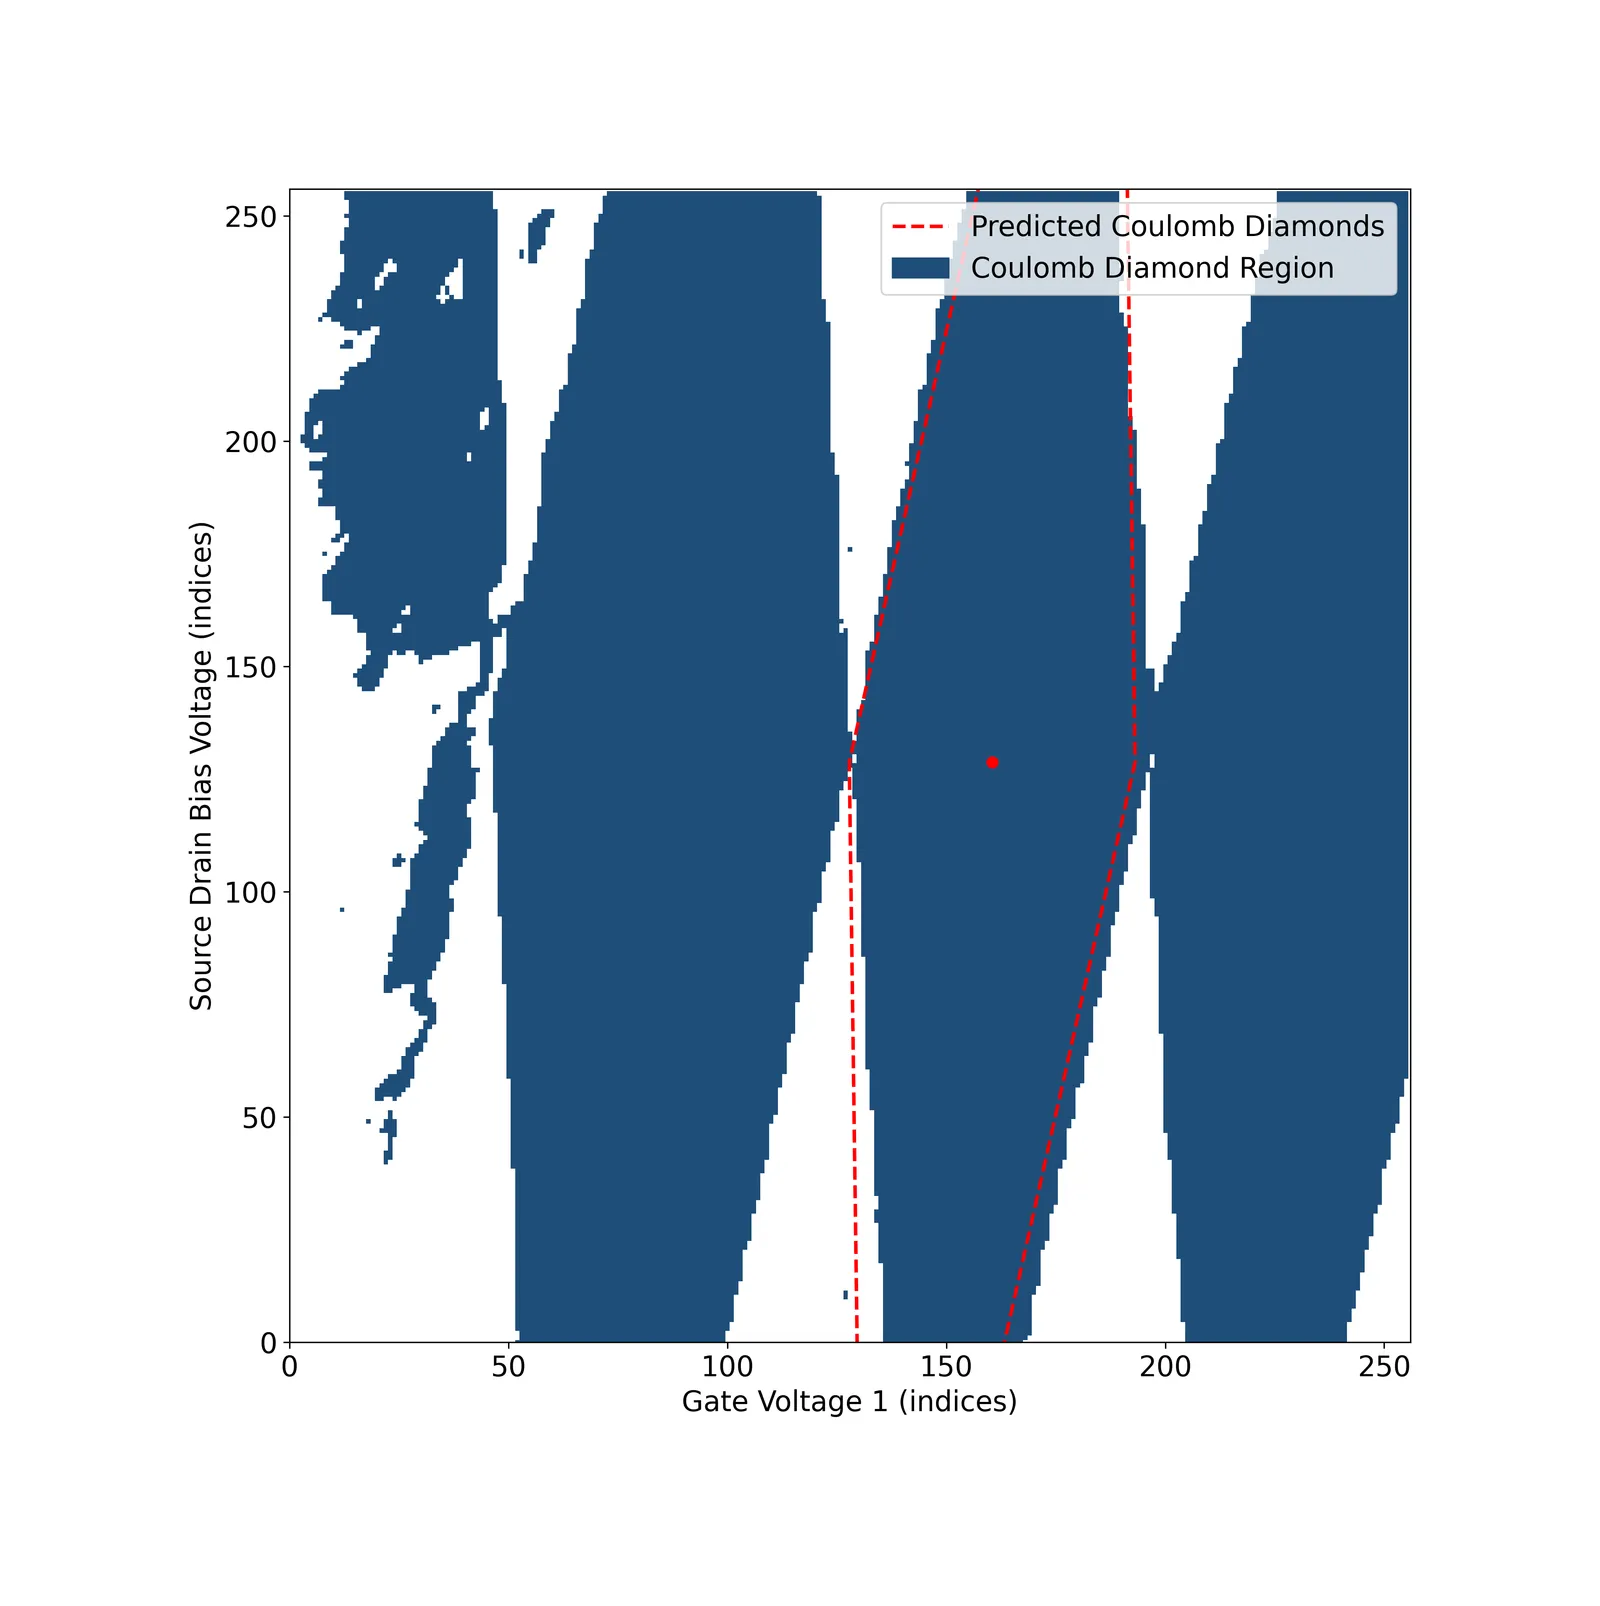
Diamond Vertices: [
{
"left": [
127.83405292034149,
128.76852416992188
],
"right": [
193.11397564411163,
128.75509643554688
],
"bottom": [
131.53489315509796,
-137.0048828125
],
"top": [
189.41313540935516,
394.52850341796875
]
}
]

The four diamond keys “left”, “right”, “bottom” and “top” correspond to each vertex of the detected Coulomb diamond.

Plotting the Output

Use the following script to visualize detected coulomb diamonds from the v0 model.
Python
from matplotlib import pyplot as plt
from matplotlib.colors import ListedColormap
fig, ax = plt.subplots(figsize=(10, 10))
colors = ["white", "#1f4e79"]
cmap = ListedColormap(colors)
ax.imshow(detection_data, cmap=cmap, aspect="auto", origin="lower")
for i, diamond in enumerate(diamond_vertices):
x_coords = [
diamond["top"][0],
diamond["right"][0],
diamond["bottom"][0],
diamond["left"][0],
diamond["top"][0],
]
y_coords = [
diamond["top"][1],
diamond["right"][1],
diamond["bottom"][1],
diamond["left"][1],
diamond["top"][1],
]
if i == 0:
ax.plot(
x_coords,
y_coords,
"r--",
linewidth=2,
label="Predicted Coulomb Diamonds",
)
else:
ax.plot(x_coords, y_coords, "r--", linewidth=2)
center_x = (diamond["top"][0] + diamond["bottom"][0]) / 2
center_y = (diamond["top"][1] + diamond["bottom"][1]) / 2
ax.plot(center_x, center_y, "ro", markersize=6)
ax.fill_between([0, 0], [0, 0], color="#1f4e79", label="Coulomb Diamond Region")
ax.set_xlabel("Gate Voltage 1 (indices)", fontsize=12)
ax.set_ylabel("Gate Voltage 2 (indices)", fontsize=12)
plt.show()
Coulomb Diamond Detector
Coulomb Diamond Segmenter v0 ➞ Coulomb Diamond Detector v0 Output

The Coulomb Diamond Detector can detect multiple coulomb diamonds. Download the following example to try it.
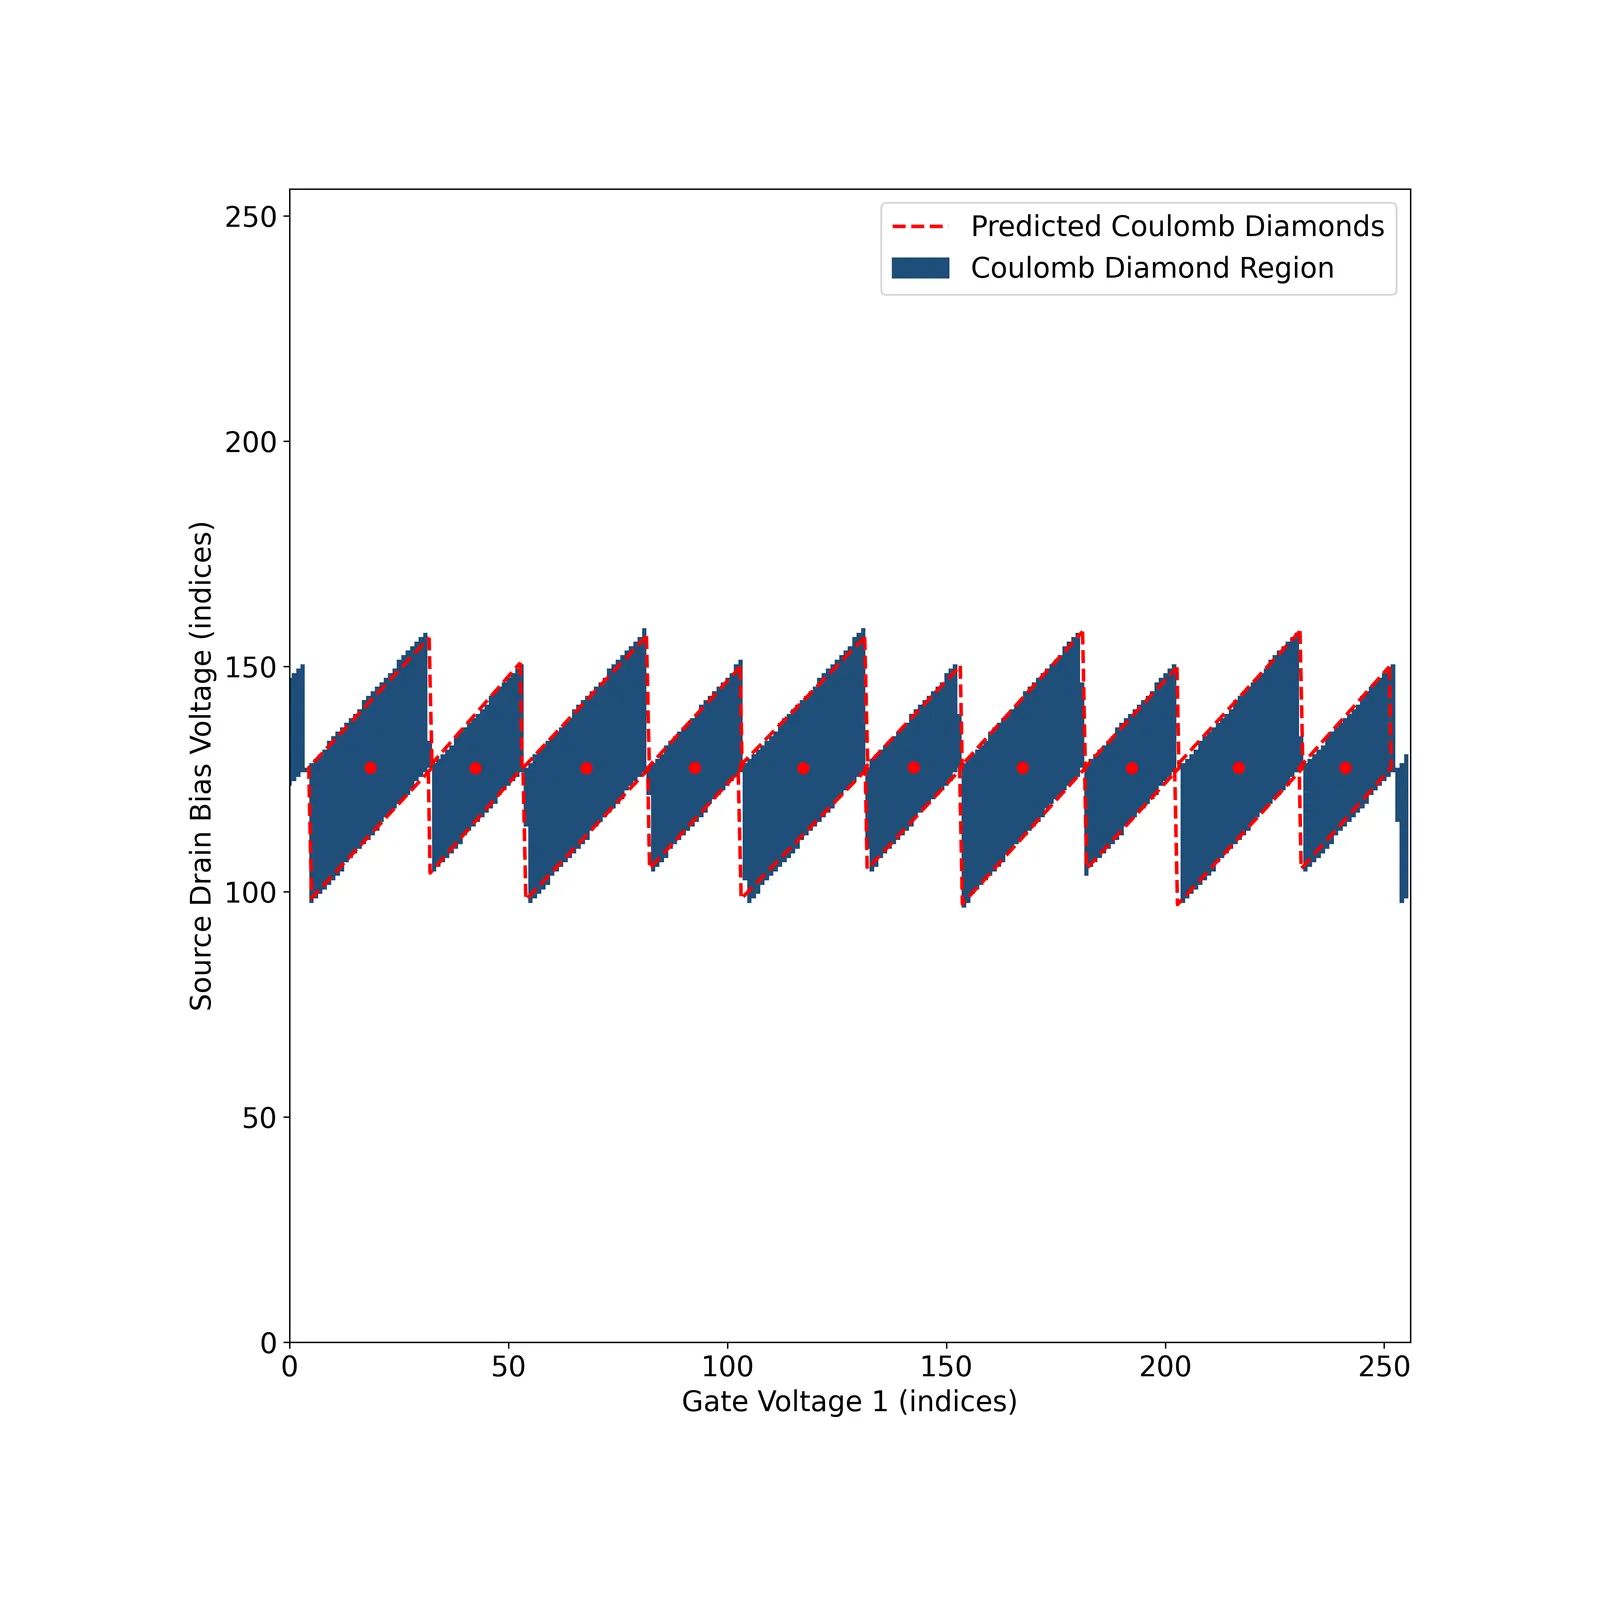
Coulomb Diamond Detector
Coulomb Diamond Detector v0 Output

Using the Coulomb Diamond Detector v1

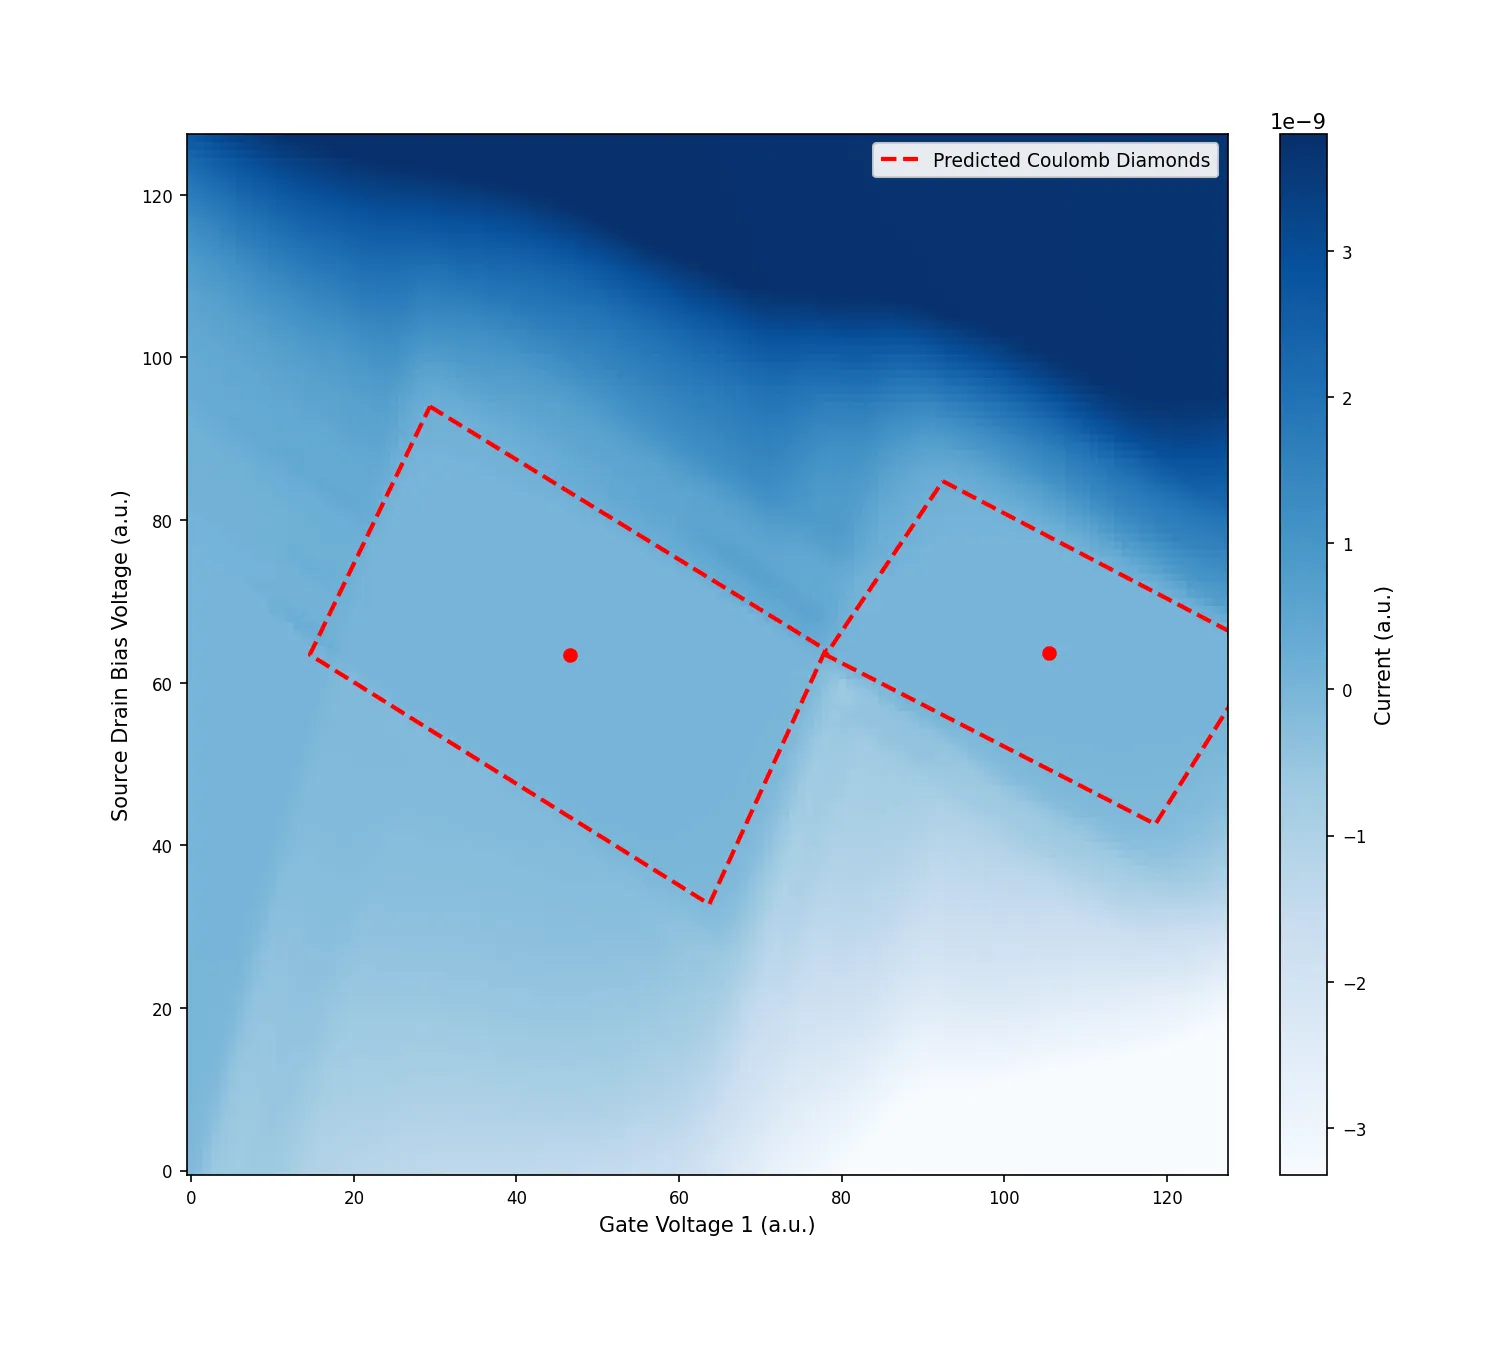
The Coulomb Diamond Detector v1 is a single-stage model that detects Coulomb diamond structures directly from raw conductance data. Unlike the v0 workflow that requires first segmenting the data with the Segmenter, the v1 Detector can be used standalone for end-to-end diamond detection.

You can download an example file to follow along with the example:

Python
from dotenv import load_dotenv
import os
import json
import numpy as np
from conductorquantum import ConductorQuantum
# Load API key from .env file
load_dotenv()
TOKEN = os.getenv("CONDUCTOR_API_KEY")
# Initialize client
client = ConductorQuantum(token=TOKEN)
# Load Coulomb Diamond conductance data (raw conductance, not a binary mask)
conductance_data = np.load("coulomb-diamond-detector-v1.npy") # shape (n, n)
# Detect diamond structures directly from conductance data
result = client.control.models.run(
model="coulomb-diamond-detector-v1",
data=conductance_data
)
# Access the diamond vertices result
diamond_vertices = result.output["diamond_vertices"]
print(f"Diamond Vertices: {json.dumps(diamond_vertices, indent=2)}")
Detector v1 Output
Diamond Vertices: [
{
"left": [
14.587324142456055,
63.440895080566406
],
"right": [
78.04255676269531,
64.06403350830078
],
"bottom": [
63.72412872314453,
32.74629592895508
],
"top": [
29.360164642333984,
93.97402954101562
]
},
{
"left": [
78.05448150634766,
63.42158508300781
],
"right": [
132.01417541503906,
64.0471420288086
],
"bottom": [
118.5890121459961,
42.59369659423828
],
"top": [
92.44355010986328,
84.79678344726562
]
}
]

Plotting the Output

Use the following script to visualize detected coulomb diamonds from the v1 model.
Python
from matplotlib import pyplot as plt
from mpl_toolkits.axes_grid1 import make_axes_locatable
fig, ax = plt.subplots(figsize=(10, 10))
ax.imshow(conductance_data, cmap="Blues", aspect="equal", origin="lower")
divider = make_axes_locatable(ax)
cax = divider.append_axes("right", size="4.5%", pad=0.35)
plt.colorbar(ax.images[0], cax=cax, label="Current (a.u.)")
for i, diamond in enumerate(diamond_vertices):
x_coords = [
diamond["top"][0],
diamond["right"][0],
diamond["bottom"][0],
diamond["left"][0],
diamond["top"][0],
]
y_coords = [
diamond["top"][1],
diamond["right"][1],
diamond["bottom"][1],
diamond["left"][1],
diamond["top"][1],
]
if i == 0:
ax.plot(
x_coords,
y_coords,
"r--",
linewidth=2,
label="Predicted Coulomb Diamonds",
)
else:
ax.plot(x_coords, y_coords, "r--", linewidth=2)
center_x = (diamond["top"][0] + diamond["bottom"][0]) / 2
center_y = (diamond["top"][1] + diamond["bottom"][1]) / 2
ax.plot(center_x, center_y, "ro", markersize=6)
ax.set_xlabel("Gate Voltage 1 (a.u.)", fontsize=10)
ax.set_ylabel("Source Drain Bias Voltage (a.u.)", fontsize=10)
ax.tick_params(axis="both", labelsize=8)
ax.legend(fontsize=9)
plt.show()
Coulomb Diamond Detector v1

Coulomb Diamond Detector v1 Output. (Data Source: Lennon, D., et al. Efficiently measuring a quantum device using machine learning. 2019. Zenodo, https://doi.org/10.5281/zenodo.2559478.)

Using the Coulomb Diamond Detector v2

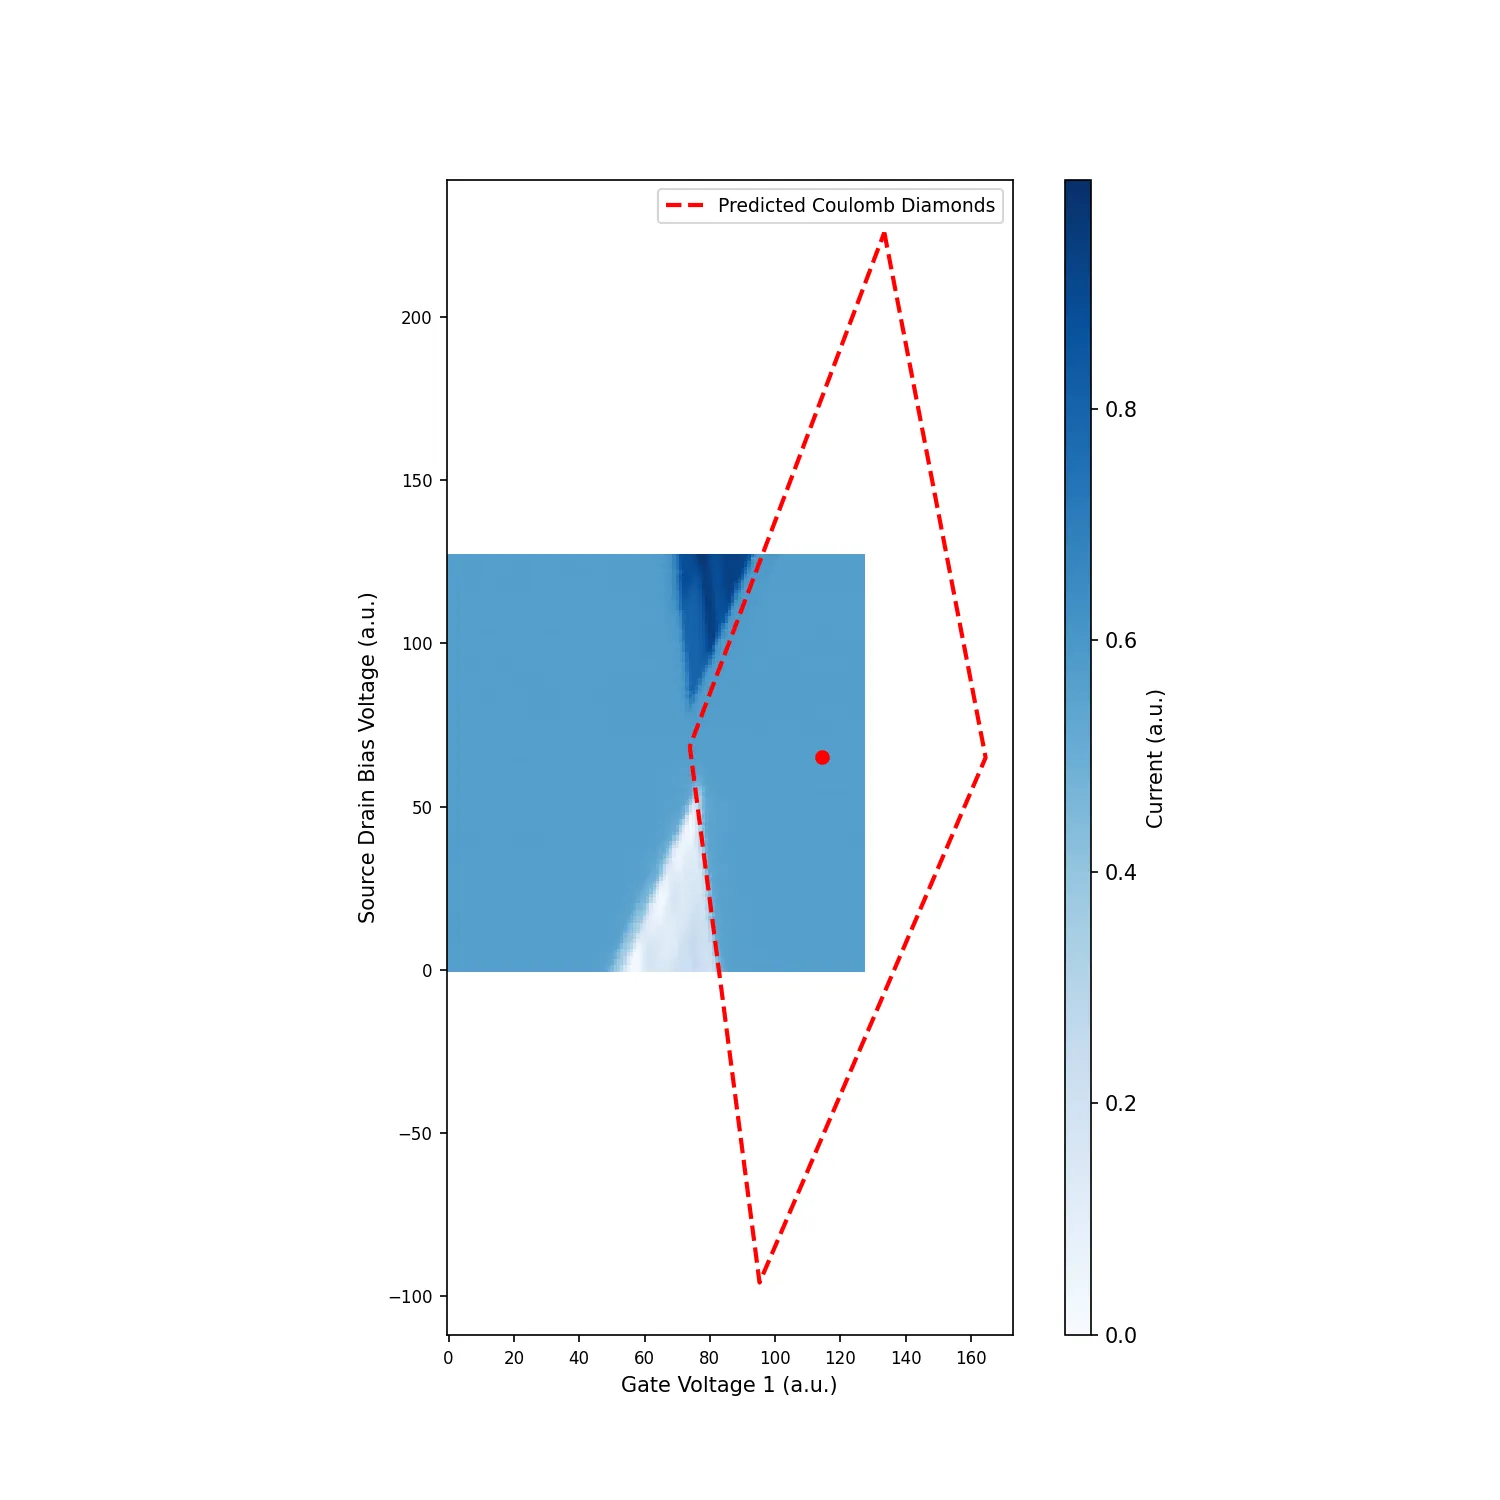
The Coulomb Diamond Detector v2 detects Coulomb diamond structures directly from current measurement data and returns the vertices of each detected diamond. Unlike v0 which requires a segmentation mask as input, v2 works directly on raw 2D current measurement grids.

Use the Coulomb Diamond Detector v2 when you have:

  • A 2D current measurement grid (e.g., current as a function of gate voltage and source-drain bias) that contains Coulomb diamond patterns
  • You want to extract the vertex coordinates of each diamond for further analysis (e.g., extracting charging energies, lever arms, or gate capacitances)

This model is a single-step solution - no prior segmentation is required.

You can download an example file to follow along with the example:

Python
from dotenv import load_dotenv
import os
import json
import numpy as np
from conductorquantum import ConductorQuantum
# Load API key from .env file
load_dotenv()
TOKEN = os.getenv("CONDUCTOR_API_KEY")
# Initialize client
client = ConductorQuantum(token=TOKEN)
# Load Coulomb Diamond conductance data (raw conductance, not a binary mask)
conductance_data = np.load("coulomb-diamond-detector-v2.npy") # shape (n, n)
# Detect diamond structures directly from conductance data
result = client.control.models.run(
model="coulomb-diamond-detector-v2",
data=conductance_data
)
# Access the diamond vertices result
diamond_vertices = result.output["diamond_vertices"]
print(f"Diamond Vertices: {json.dumps(diamond_vertices, indent=2)}")
Detector v2 Output
Diamond Vertices: [
{
"left": [
73.8751220703125,
68.38318634033203
],
"top": [
133.4462432861328,
225.84364318847656
],
"right": [
164.4794464111328,
65.03285217285156
],
"bottom": [
95.2346420288086,
-95.74405670166016
]
}
]

Plotting the Output

Use the following script to visualize detected coulomb diamonds from the v2 model.
Python
from matplotlib import pyplot as plt
from mpl_toolkits.axes_grid1 import make_axes_locatable
fig, ax = plt.subplots(figsize=(10, 10))
ax.imshow(conductance_data, cmap="Blues", aspect="equal", origin="lower")
divider = make_axes_locatable(ax)
cax = divider.append_axes("right", size="4.5%", pad=0.35)
plt.colorbar(ax.images[0], cax=cax, label="Current (a.u.)")
for i, diamond in enumerate(diamond_vertices):
x_coords = [
diamond["top"][0],
diamond["right"][0],
diamond["bottom"][0],
diamond["left"][0],
diamond["top"][0],
]
y_coords = [
diamond["top"][1],
diamond["right"][1],
diamond["bottom"][1],
diamond["left"][1],
diamond["top"][1],
]
if i == 0:
ax.plot(
x_coords,
y_coords,
"r--",
linewidth=2,
label="Predicted Coulomb Diamonds",
)
else:
ax.plot(x_coords, y_coords, "r--", linewidth=2)
center_x = (diamond["top"][0] + diamond["bottom"][0]) / 2
center_y = (diamond["top"][1] + diamond["bottom"][1]) / 2
ax.plot(center_x, center_y, "ro", markersize=6)
ax.set_xlabel("Gate Voltage 1 (a.u.)", fontsize=10)
ax.set_ylabel("Source Drain Bias Voltage (a.u.)", fontsize=10)
ax.tick_params(axis="both", labelsize=8)
ax.legend(fontsize=9)
plt.show()
Coulomb Diamond Detector v2

Coulomb Diamond Detector v2 Output. (Data Source: Lennon, D., et al. Efficiently measuring a quantum device using machine learning. 2019. Zenodo, https://doi.org/10.5281/zenodo.2559478.)

Important Notes for Coulomb Diamond Models

  • Input dimensions: Input dimensions should ideally match the specified resolution of the model for the best results. You may need to interpolate or downsample your data to match the required shape. You can find the required input shapes for each model on the models overview page.
  • Data format: Input data should be a 2D numpy array representing a conductance measurement grid as a function of two gate voltages.
  • Output format:
    • The Segmenter outputs a binary mask where 1.0 indicates regions of Coulomb Blockade (i.e., the diamond region) and 0.0 indicates regions of current flow.
    • The Detector outputs diamond vertices in pixel index coordinates. Each diamond is represented by four vertices: “left”, “right”, “bottom”, and “top”.
  • Model workflow:
    • v0 (two-stage): The Coulomb Diamond Segmenter and Detector v0 models are designed to be used sequentially. First, use the Segmenter to create a binary mask, then use the Detector v0 on that mask to identify diamond vertices.
    • v1 (single-stage): The Coulomb Diamond Detector v1 is a single-stage model that detects diamond vertices directly from raw conductance data. No segmentation step is required.
    • v2 (single-stage): The Coulomb Diamond Detector v2 is a single-stage model that detects diamond vertices directly from raw conductance data. No segmentation step is required.
  • Drop-in replacement: v2 uses the same output format (diamond_vertices with left, top, right, bottom keys) as v0 and v1, so it can replace previous versions without changing downstream code.
  • Model versions: Higher version numbers typically indicate improved accuracy and performance. Check the models overview for the latest available versions.