

Using the Charge Stability Diagram Models
Installation
We recommend using pip, poetry, or uv to install the package.
Authentication
The SDK requires an API key for authentication. Sign in and create a new API key. Remember, your API key is your access secret - keep it safe with environment variables.
Using environment variables:
Or provide the API key directly:
Usage Examples
Using the Charge Stability Diagram Segmenter
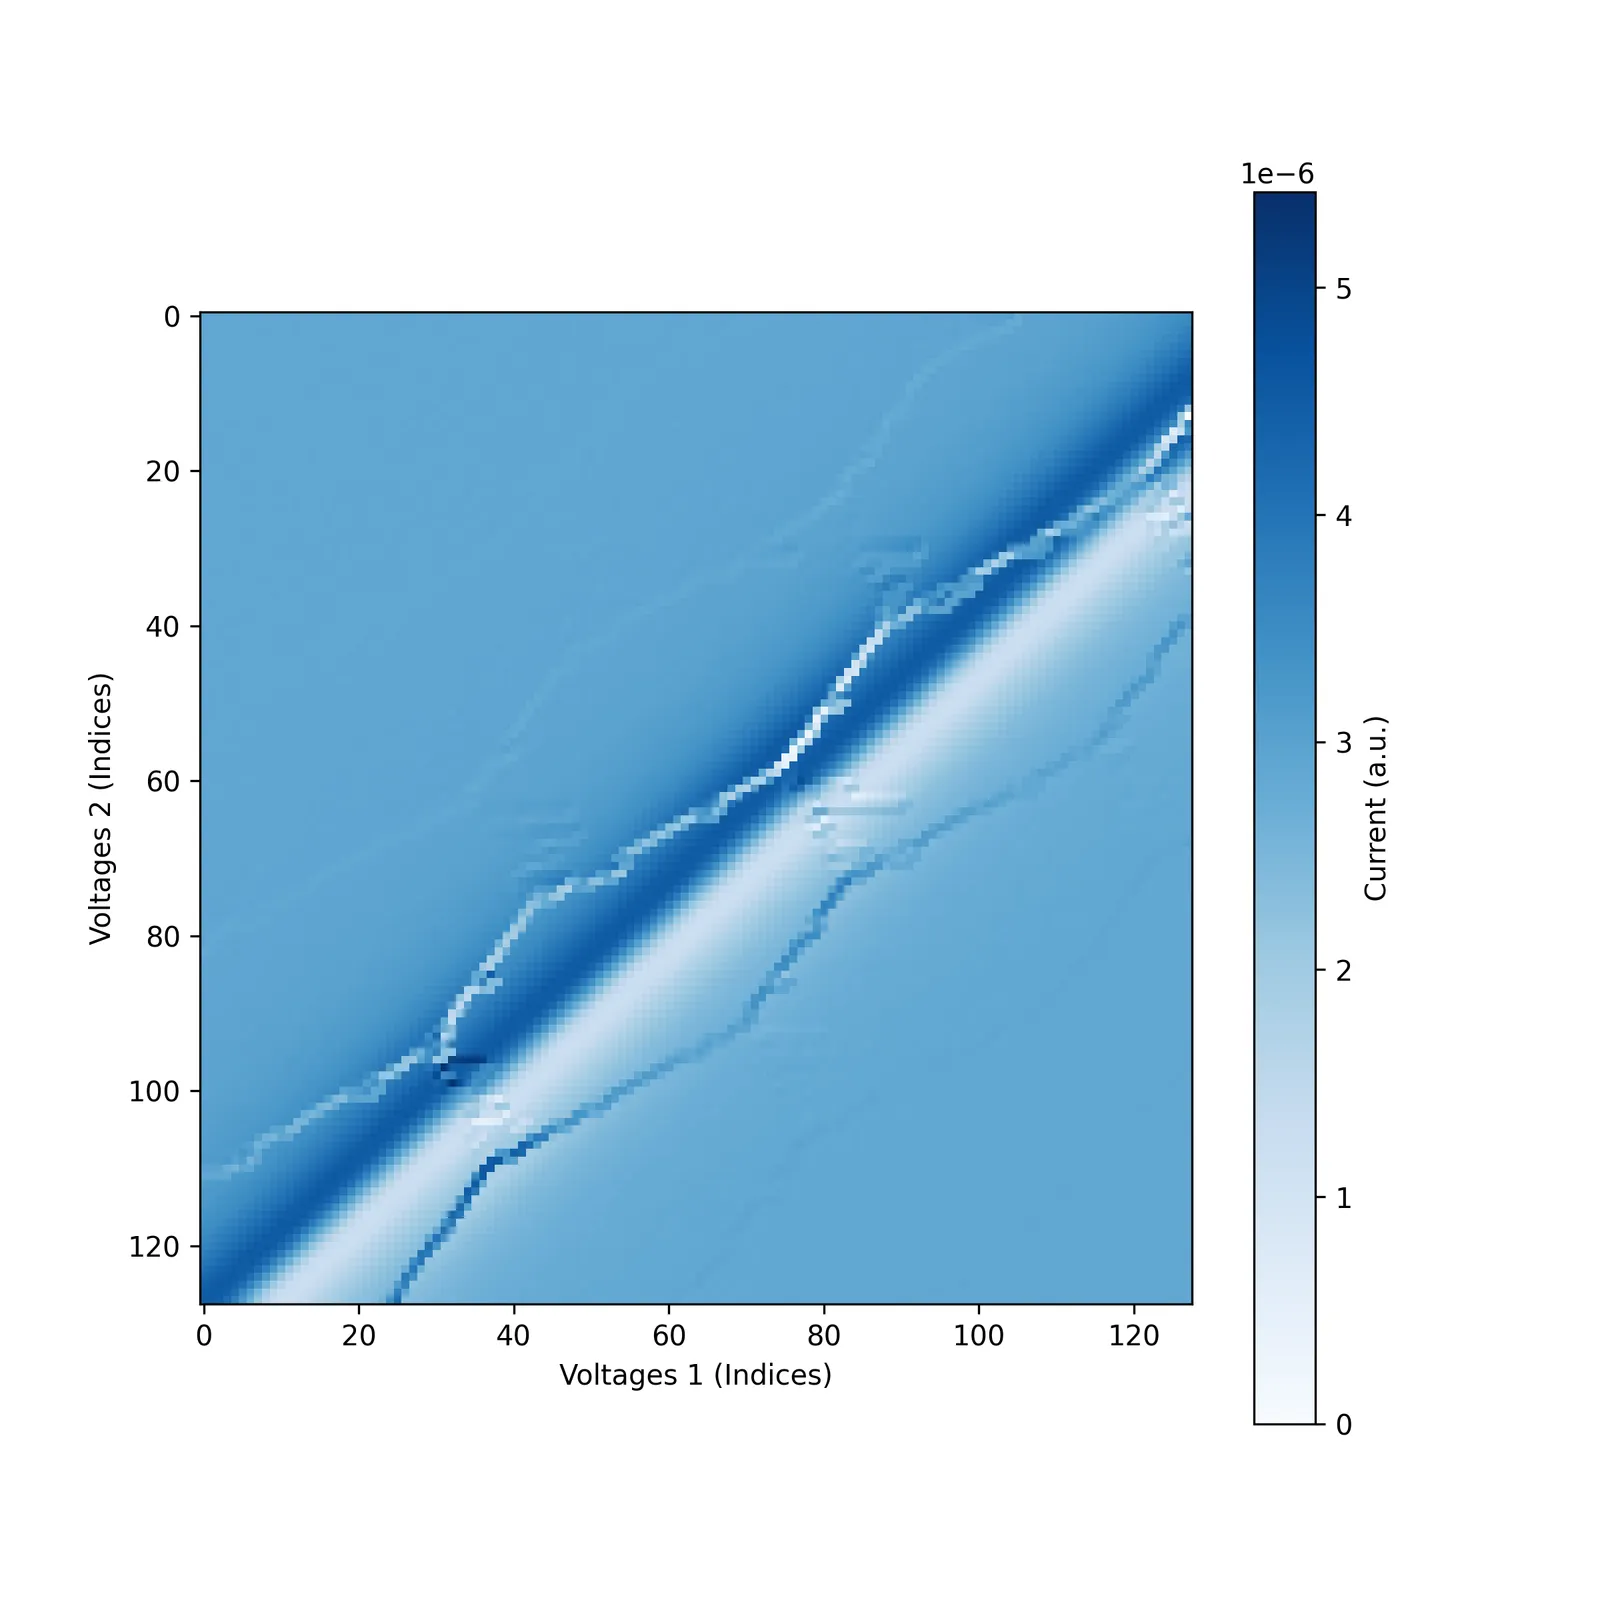
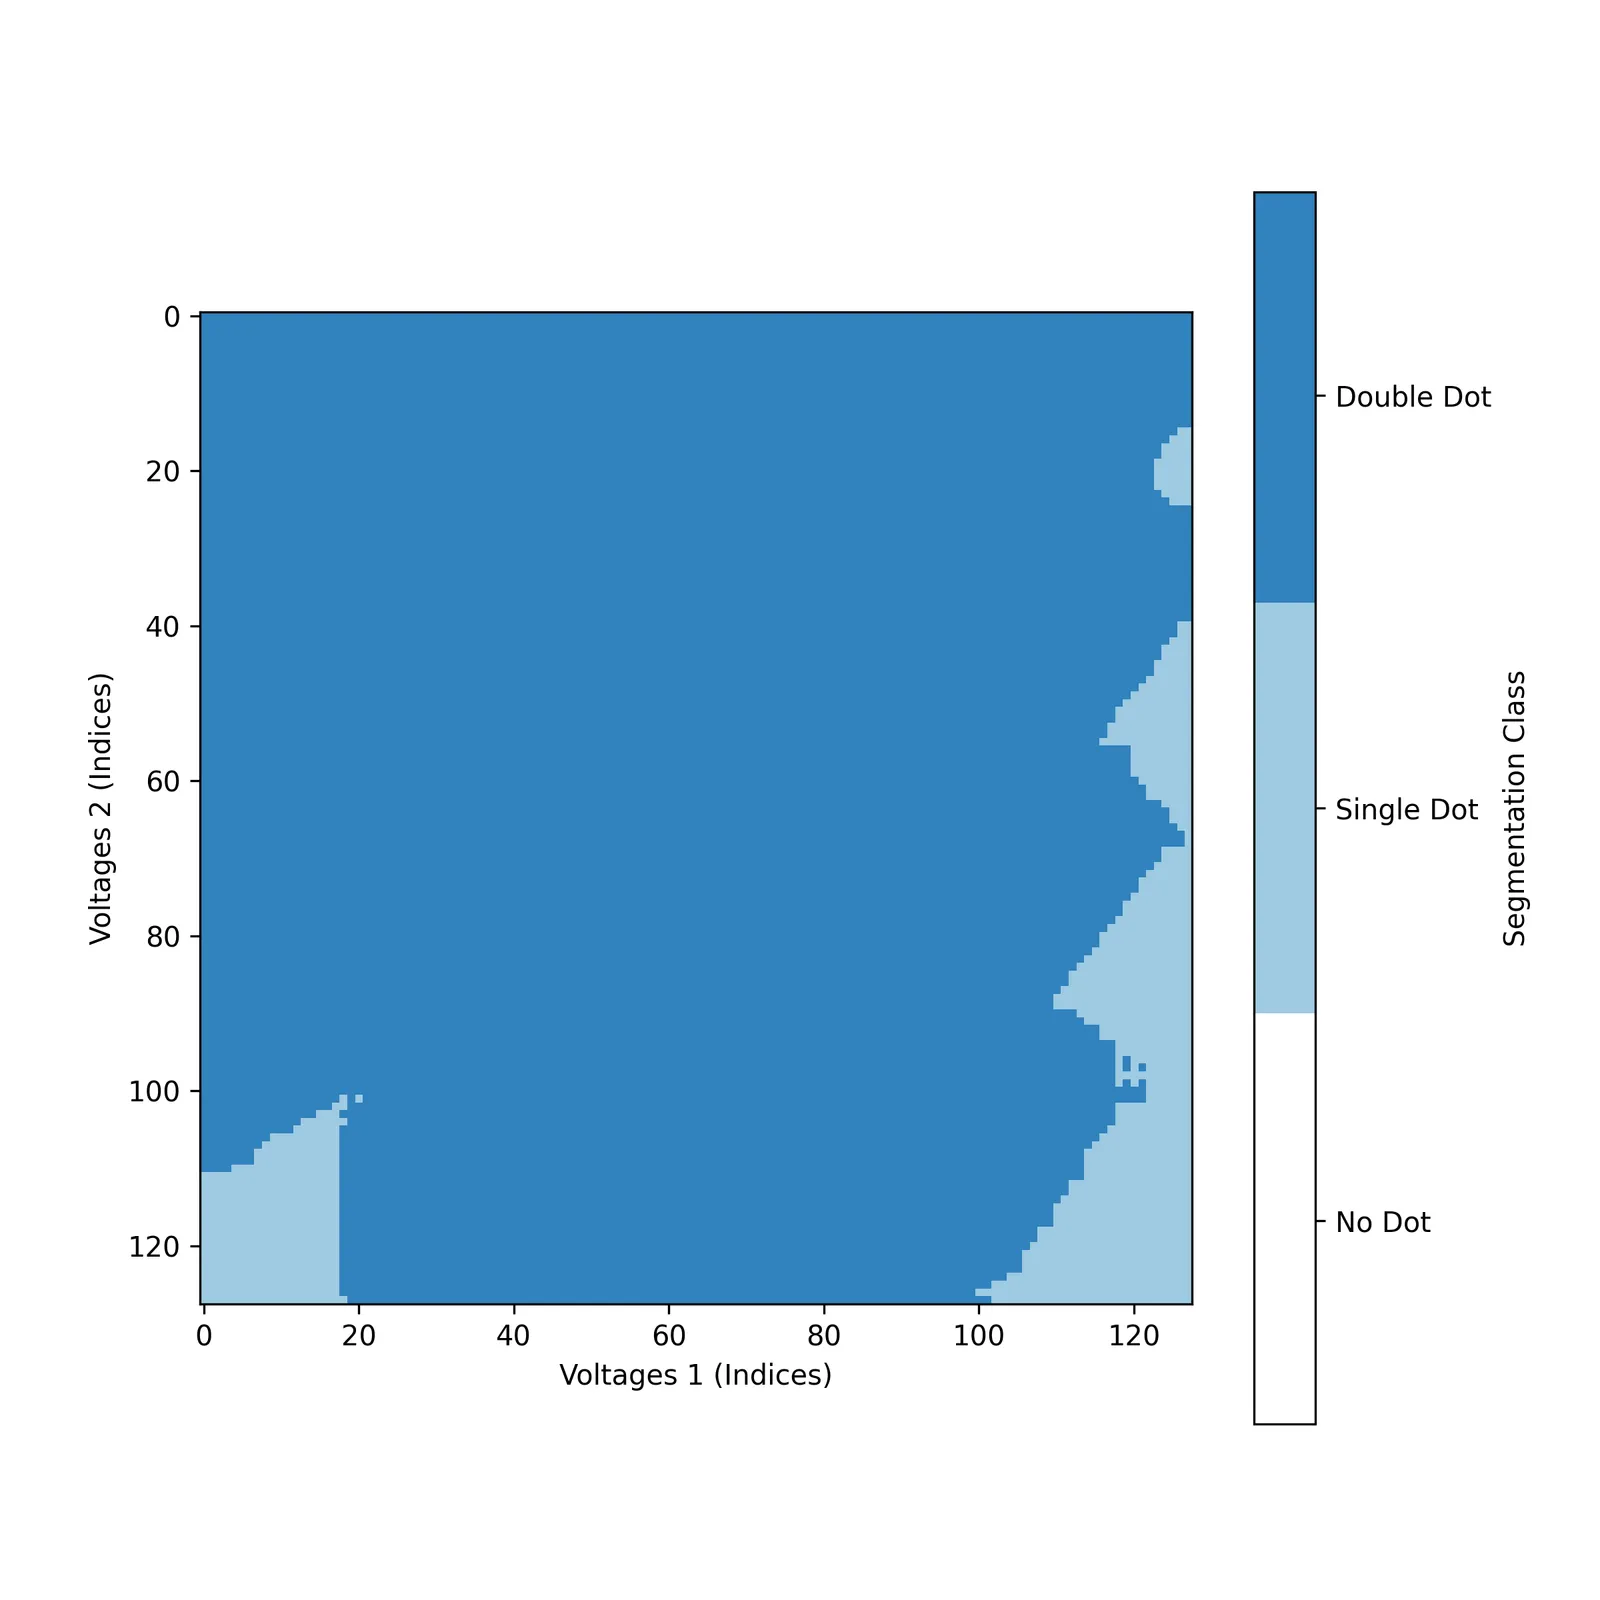
The Charge Stability Diagram Segmenter is a model that can segment a given measurement into different charge stability regimes: no dot (0), single dot (1), and double dot (2).
You can download an example file to follow along with the example:
Using the Charge Transition Line Detector
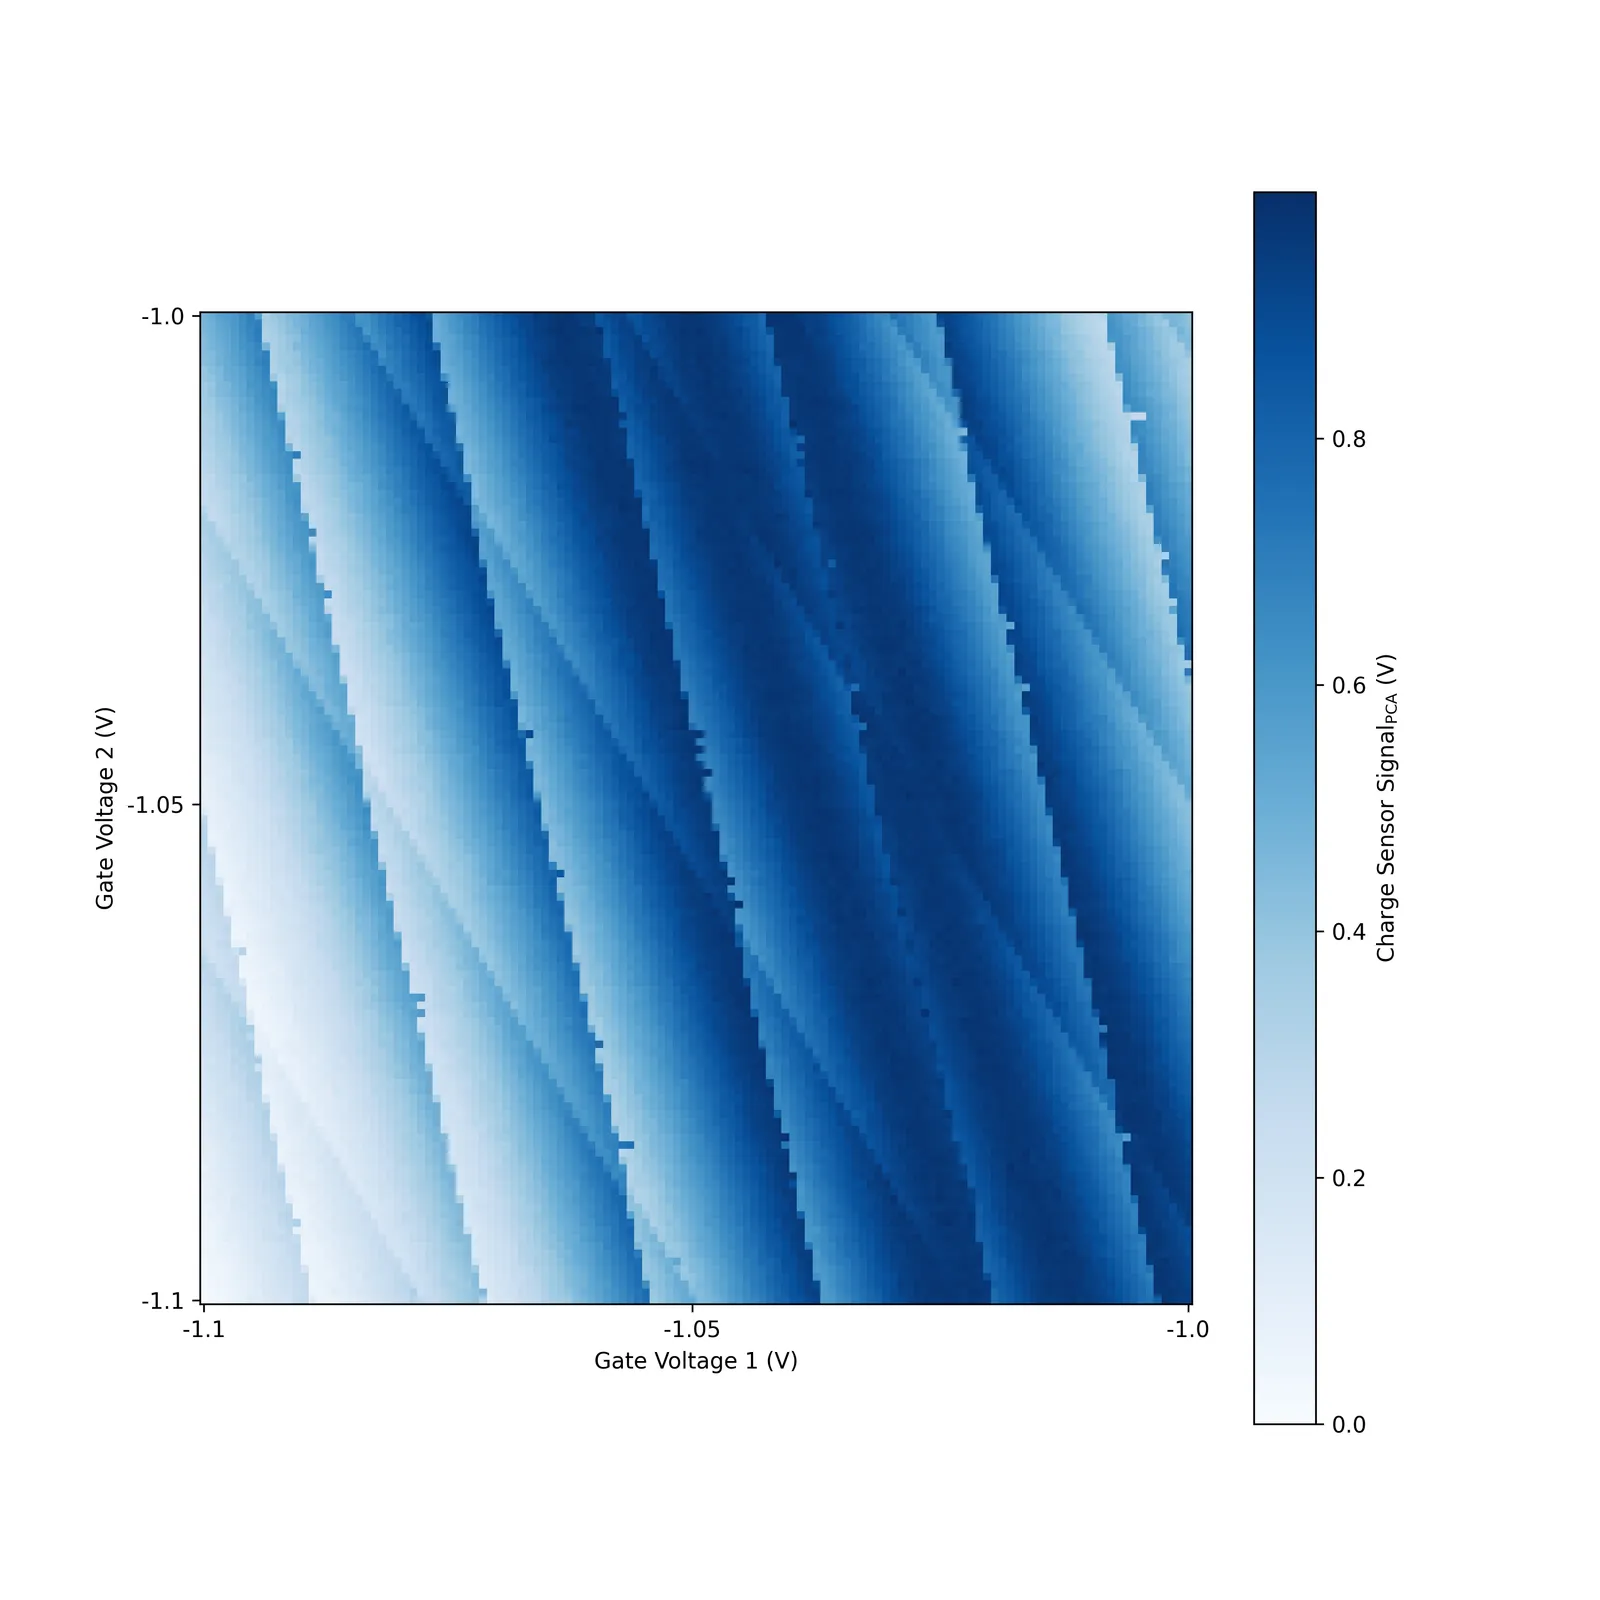
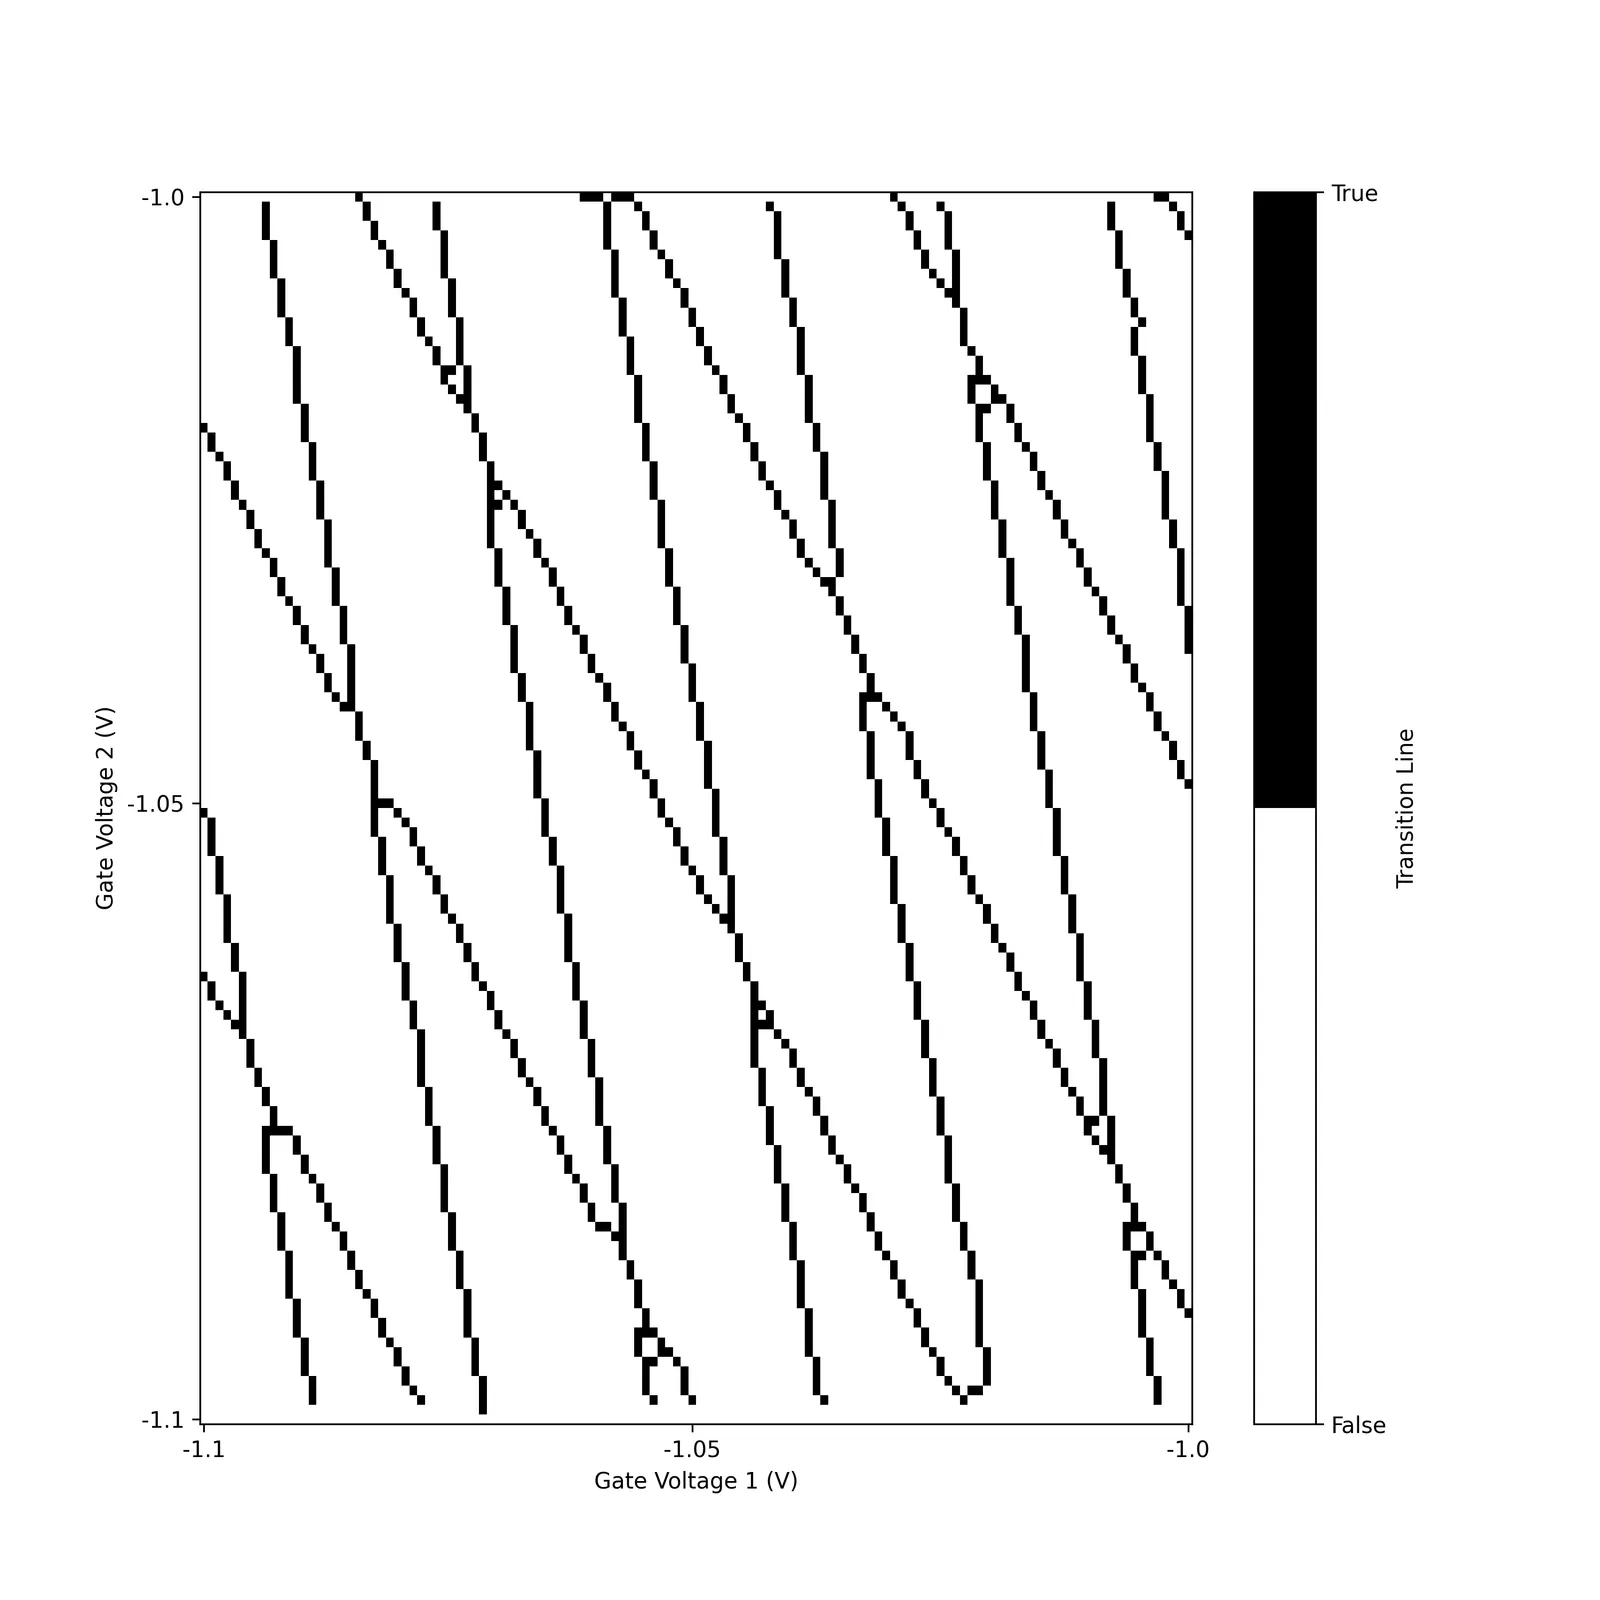
The Charge Transition Line Detector is a model that detects the locations of charge transition lines in a charge stability diagram.
You can download an example file to follow along with the example:
Using the Charge Stability Diagram Binary Classifier
There are two versions of the Charge Stability Diagram (CSD) binary classifier available: one for 16x16 input arrays and one for 48x48 arrays. Both models classify a CSD as either “double dot” (1) or “not double dot” (0).
Charge Stability Diagram Data Requirements
- Input shape: (16, 16) or (48, 48)
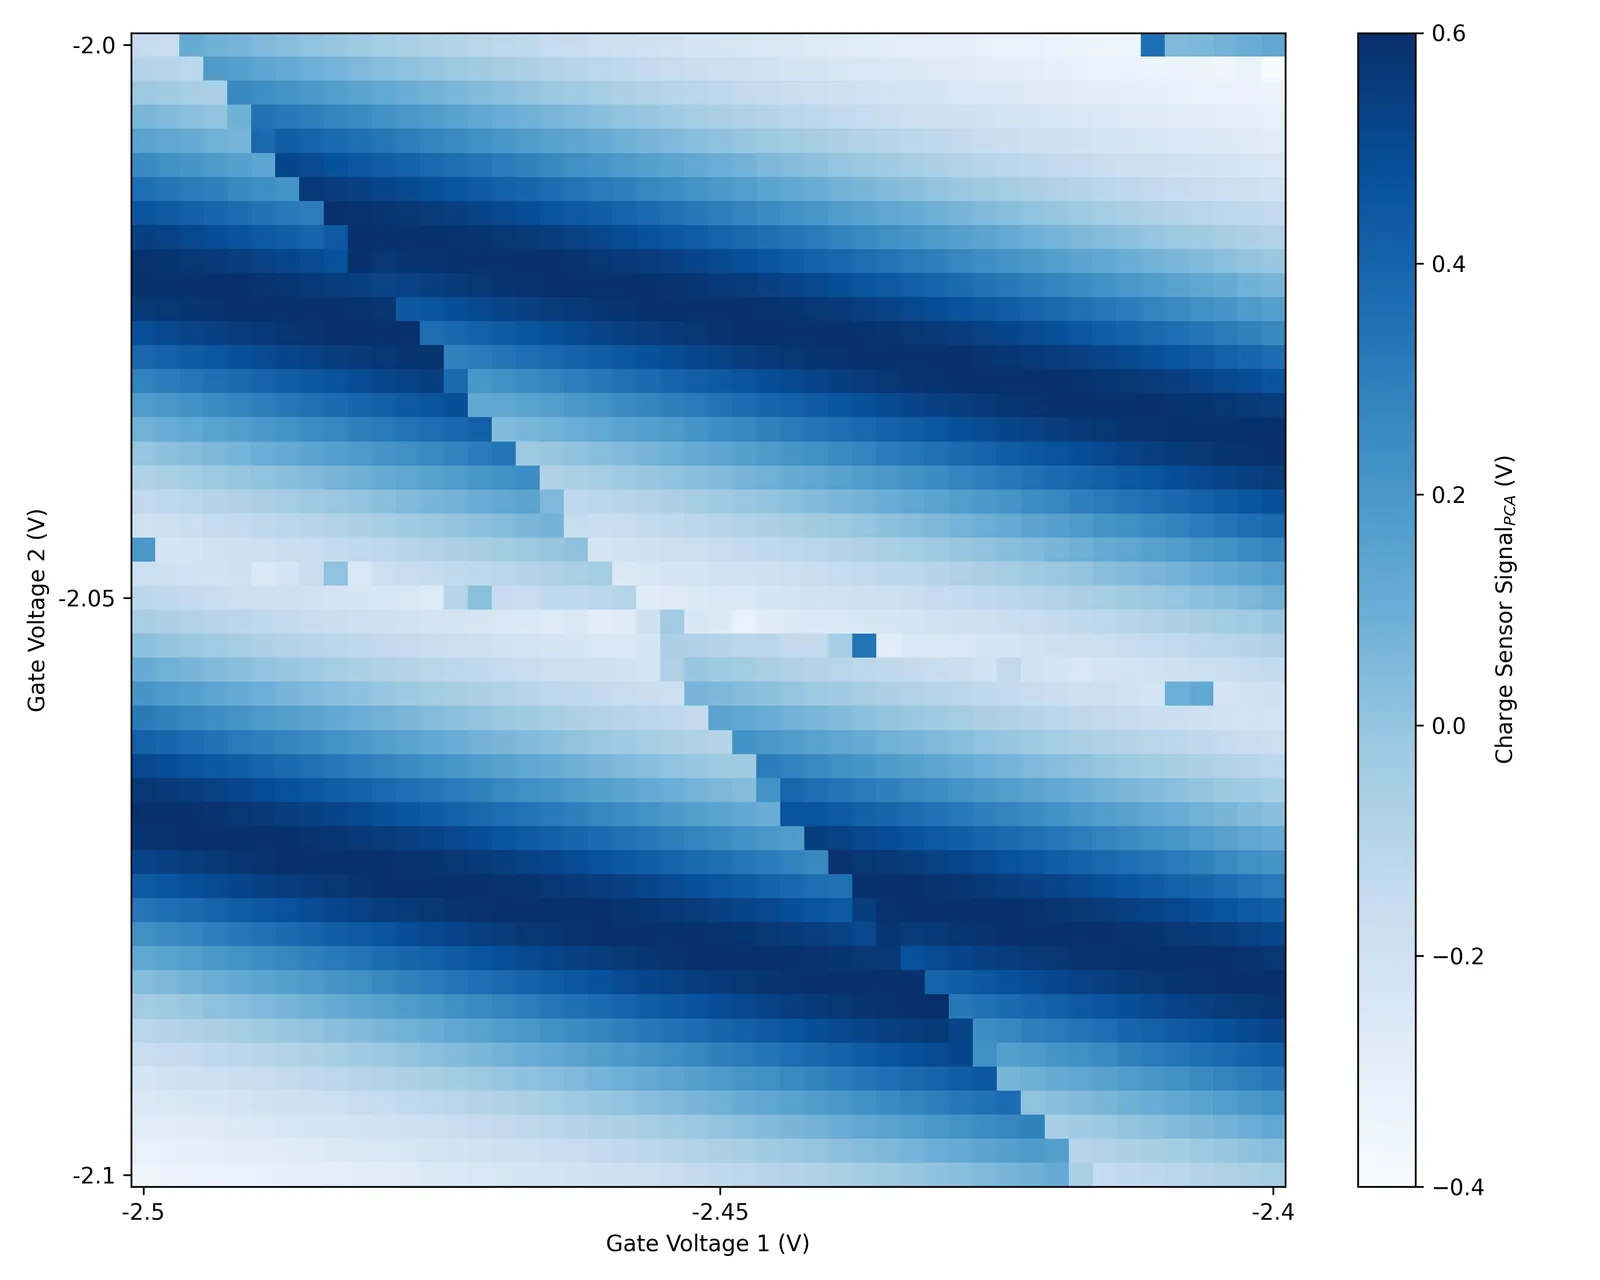
- Data: 2D numpy array representing transport current or charge sensor signal
To choose the appropriate model, use the suffix in the model string:
- For 48x48 data:
charge-stability-diagram-binary-classifier-v0-48x48 - For 16x16 data:
charge-stability-diagram-binary-classifier-v0-16x16
You can download a sample 48x48 input file here to follow along with the example.
Important Notes for Charge Stability Diagram Models
- Input dimensions: Input dimensions should ideally match the specified resolution of the model for the best results. You may need to interpolate or downsample your data to match the required shape. You can find the required input shapes for each model on the models overview page.
- Data format: Input data should be a 2D numpy array representing transport current or charge sensor signal values. Each value in the input array corresponds to a point in the charge stability diagram for a set of two plunger gate voltages.
- Output format:
- The segmenter outputs a 2D array with integer labels: 0 (no dot), 1 (single dot), or 2 (double dot).
- The transition detector outputs a 2D array with binary values (0.0 or 1.0) indicating transition line locations.
- The binary classifier outputs a classification (0 or 1) and a confidence score.
- Model versions: Higher version numbers typically indicate improved accuracy and performance. Check the models overview for the latest available versions.