

Live Plotting
Visualize your data in real-time as routines execute. Stanza supports two plotting backends to fit different workflows - whether you’re working in a Jupyter notebook, running scripts from the command line, or running routines in your IDE.
Quick Start with CLI
Enable live plotting in your notebook or script with a single command:
Once enabled, the DataLogger automatically detects the configuration and streams data to plots as your routines run.
Python API
You can also enable live plotting programmatically for more control over the plotting backend and configuration.
Server Backend
Opens plots in a browser window - works in any environment including remote servers:
The server backend is ideal for:
- Remote development environments
- Long-running experiments you want to monitor from another machine
- Situations where you want plots separate from your notebook
Inline Backend
Displays plots directly in notebook cells - requires jupyter_bokeh (pip install “cq-stanza[notebook]”):
The inline backend is ideal for:
- Interactive notebook workflows
- Quick data exploration
- When you want plots embedded alongside your code
Installation Requirements
The server backend works out of the box with Stanza. For inline plotting in Jupyter notebooks, install the additional dependency:
Plot Types
Stanza automatically chooses the appropriate plot type based on your data:
1D Line Plots: Used for single-parameter sweeps like barrier gate pinchoffs or plunger gate sweeps. The x-axis shows the swept voltage, and the y-axis shows the measured signal (typically current).
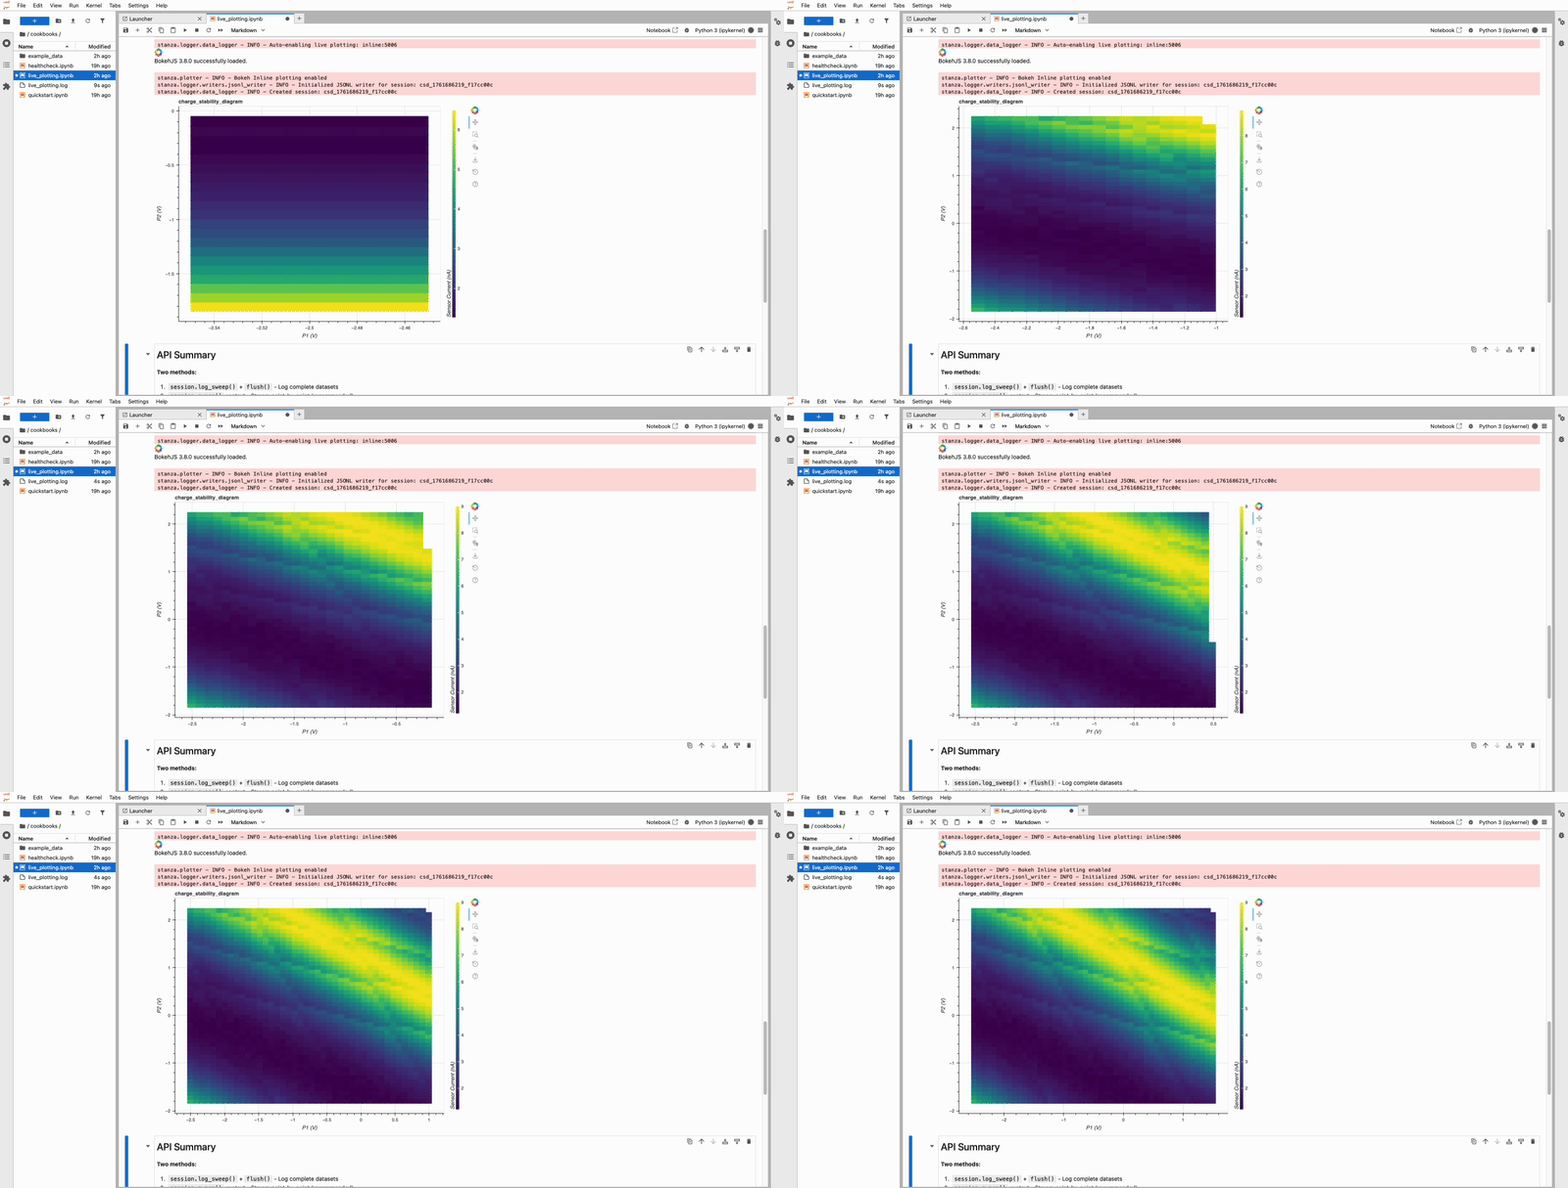
2D Heatmaps: Used for two-parameter sweeps like charge stability diagrams. Both axes show swept voltages, and the color represents the measured signal intensity.
Plots update in real-time as data is logged, allowing you to monitor your measurements as they run and make decisions about whether to continue or adjust parameters.
Complete Example
Here’s a complete workflow using live plotting with a barrier sweep:
Disabling Live Plotting
To disable live plotting:
Or programmatically:
Tips and Best Practices
Use server backend for remote work: If you’re SSH’d into a lab computer, the server backend lets you view plots in your local browser by port forwarding:
Monitor long measurements: Live plotting is especially useful for long 2D sweeps where you want to see data quality before the entire measurement completes.
Adjust plot refresh rate: For very fast measurements, you may want to reduce plot update frequency to avoid performance overhead. This can be configured through the plotting backend initialization.
Check data quality early: Live plots let you catch issues like noise, drift, or saturation early in your measurement, saving time by allowing you to stop and adjust parameters if needed.
Next Steps
- Data Logging - Learn how to configure the DataLogger that feeds live plotting
- Routines - Write routines that automatically stream data to plots
- Device Configuration - Set up your device for measurements